What it does
The unit is built around an ESP32 and a 480 × 320 touch screen. It connects to your home Wi-Fi, collects its data in the background and shows it on eight pages. Swipe left or right to change page. It also starts up with the Guernsey Amateur Radio Society emblem.
Solar
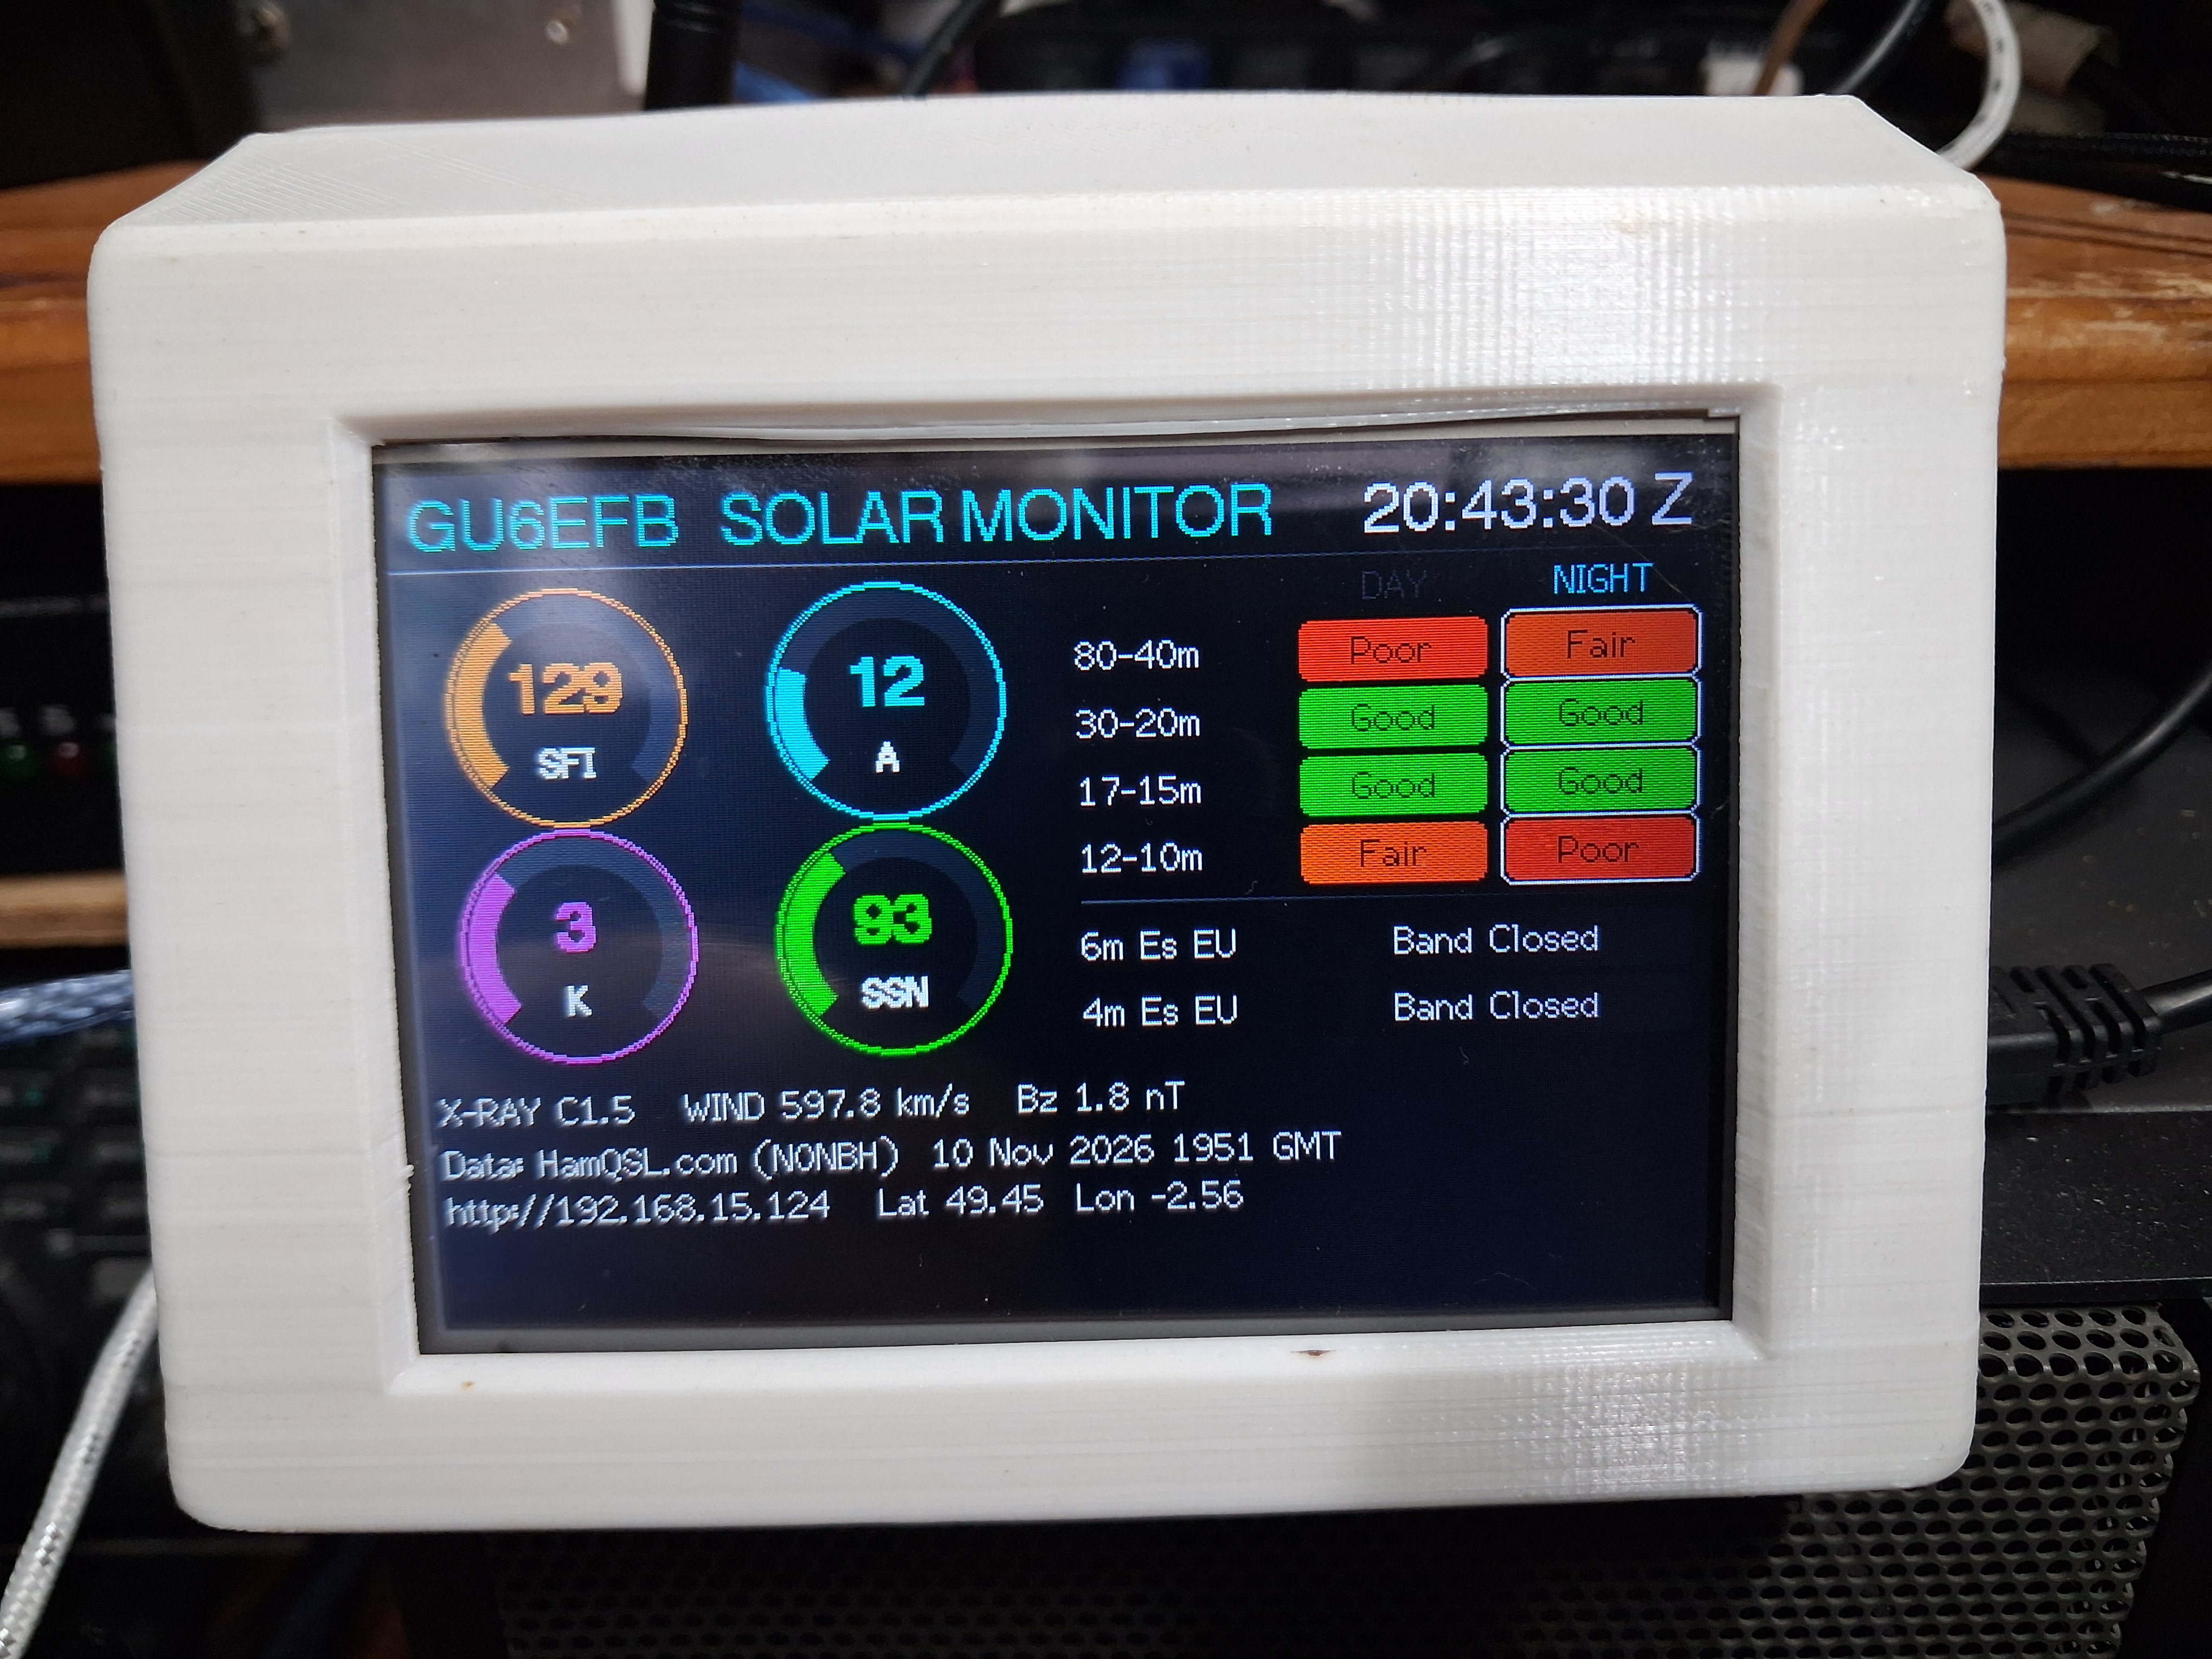
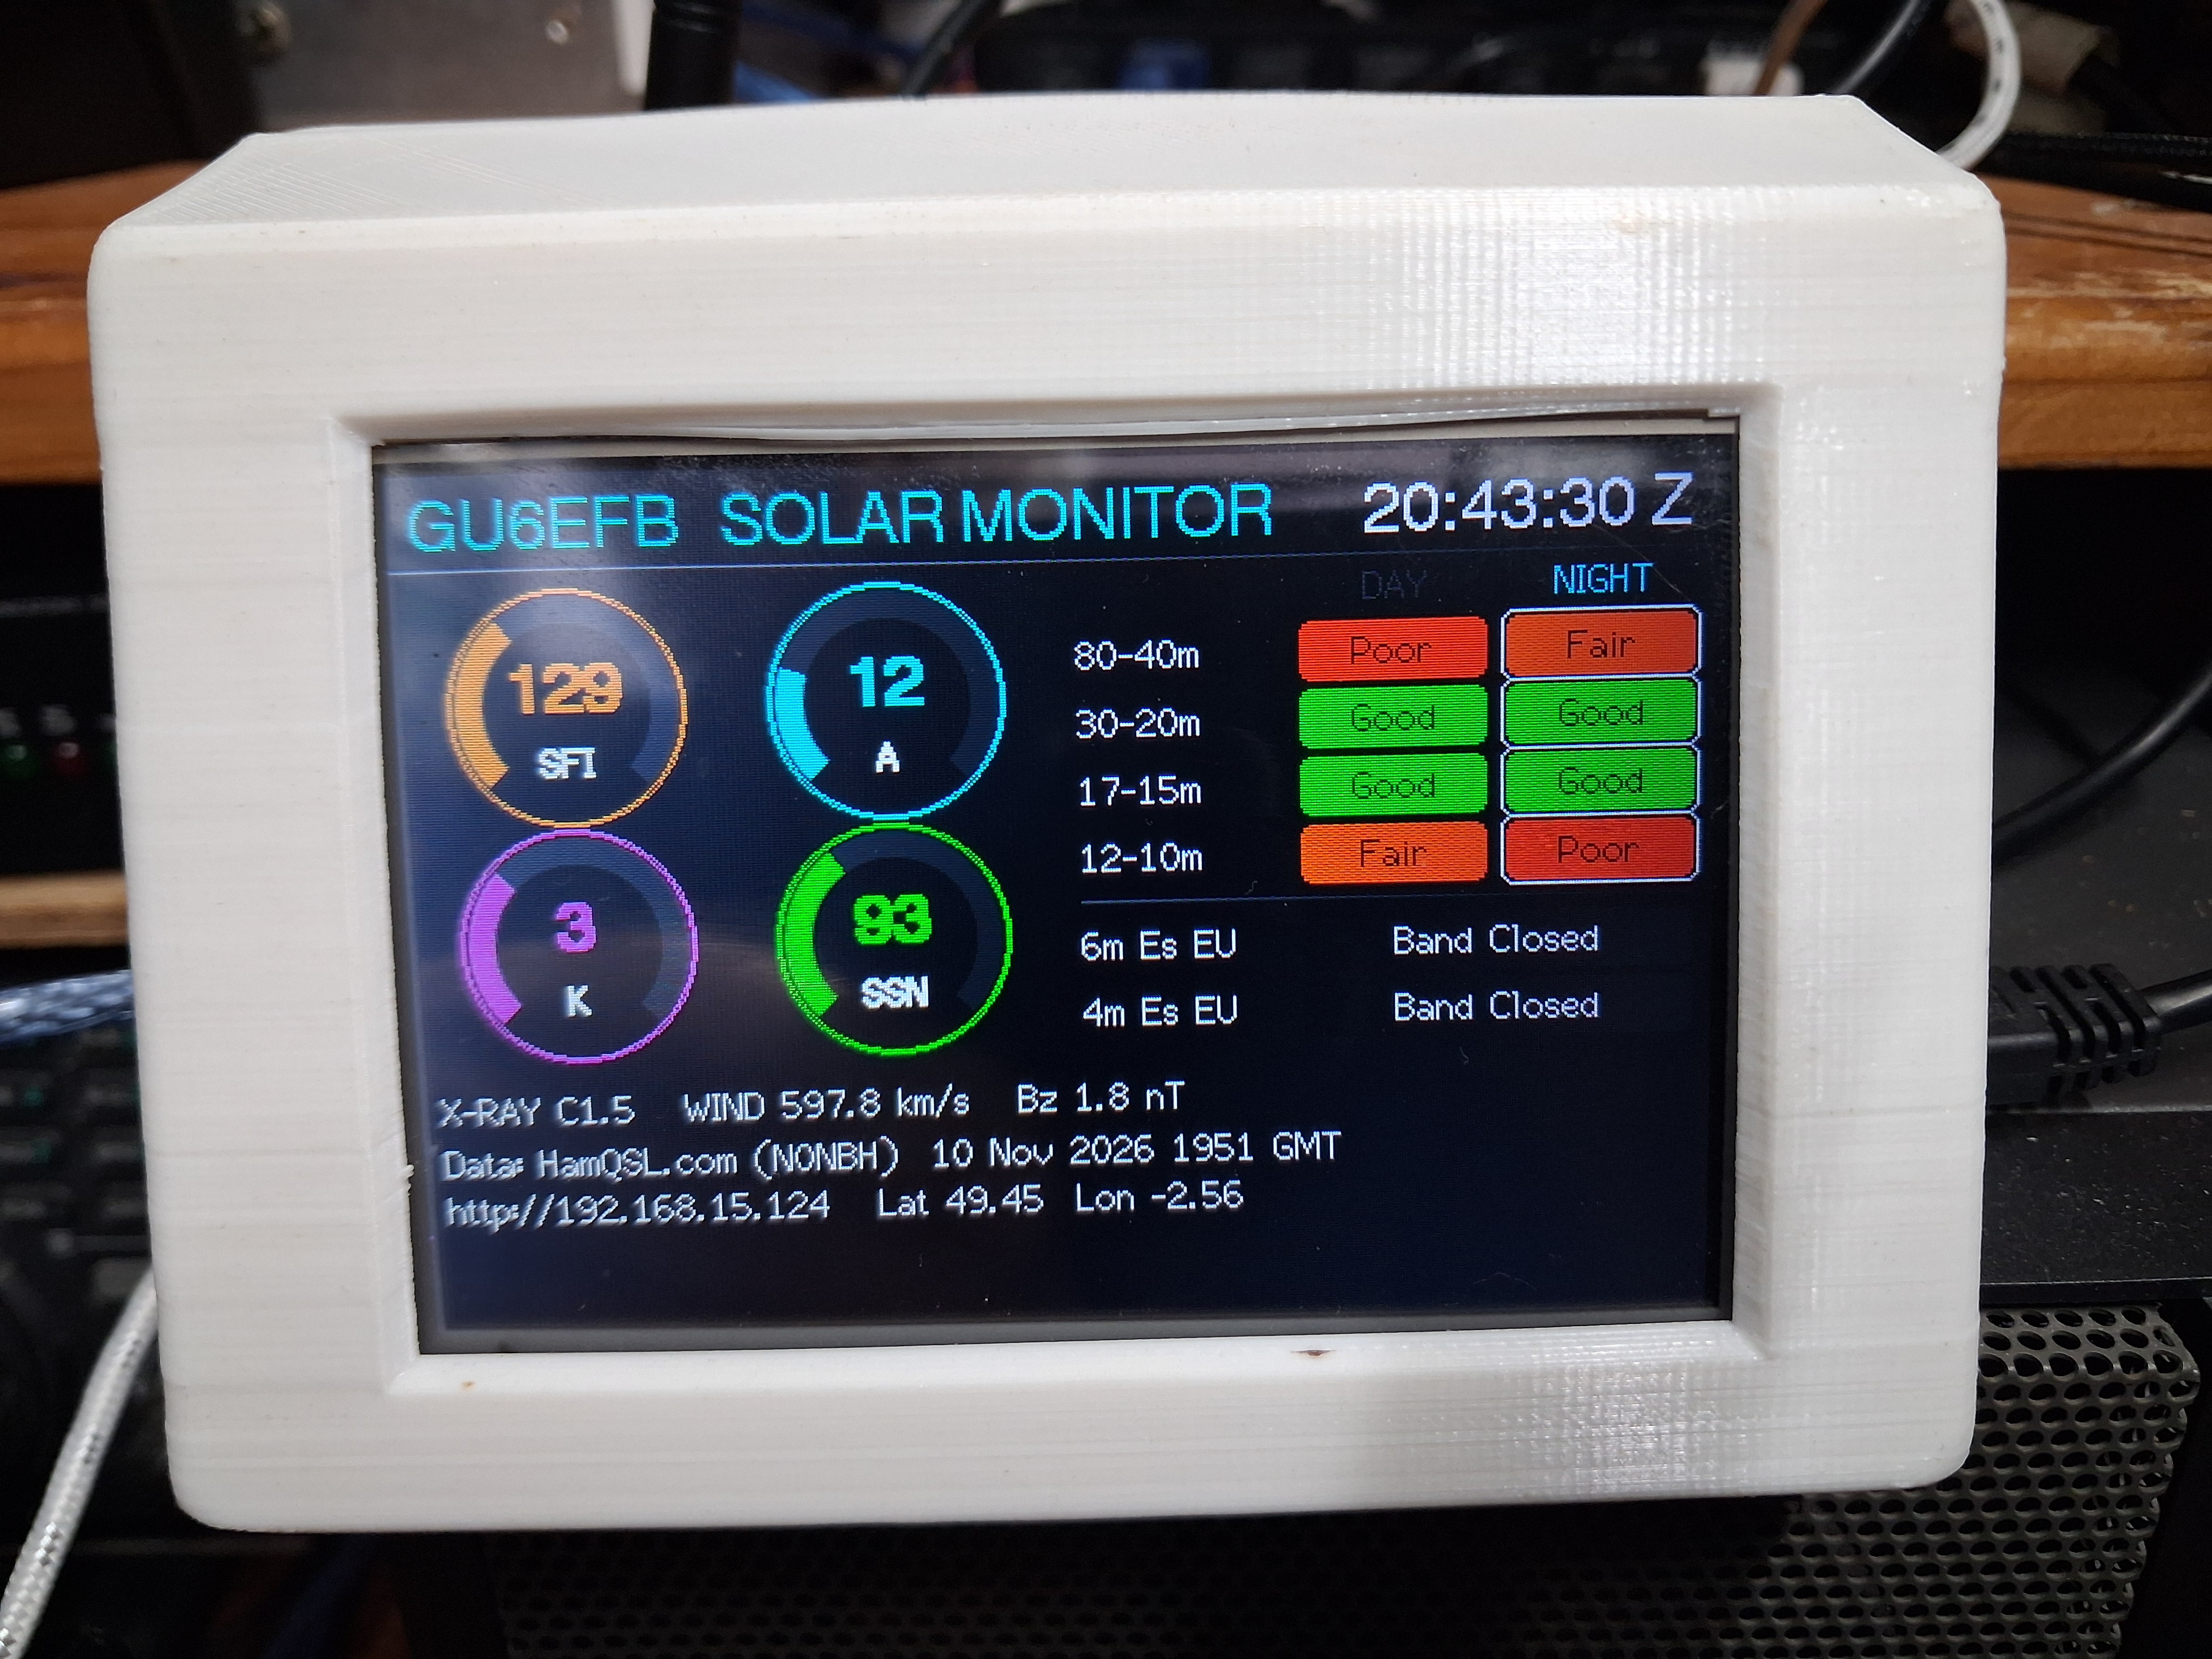
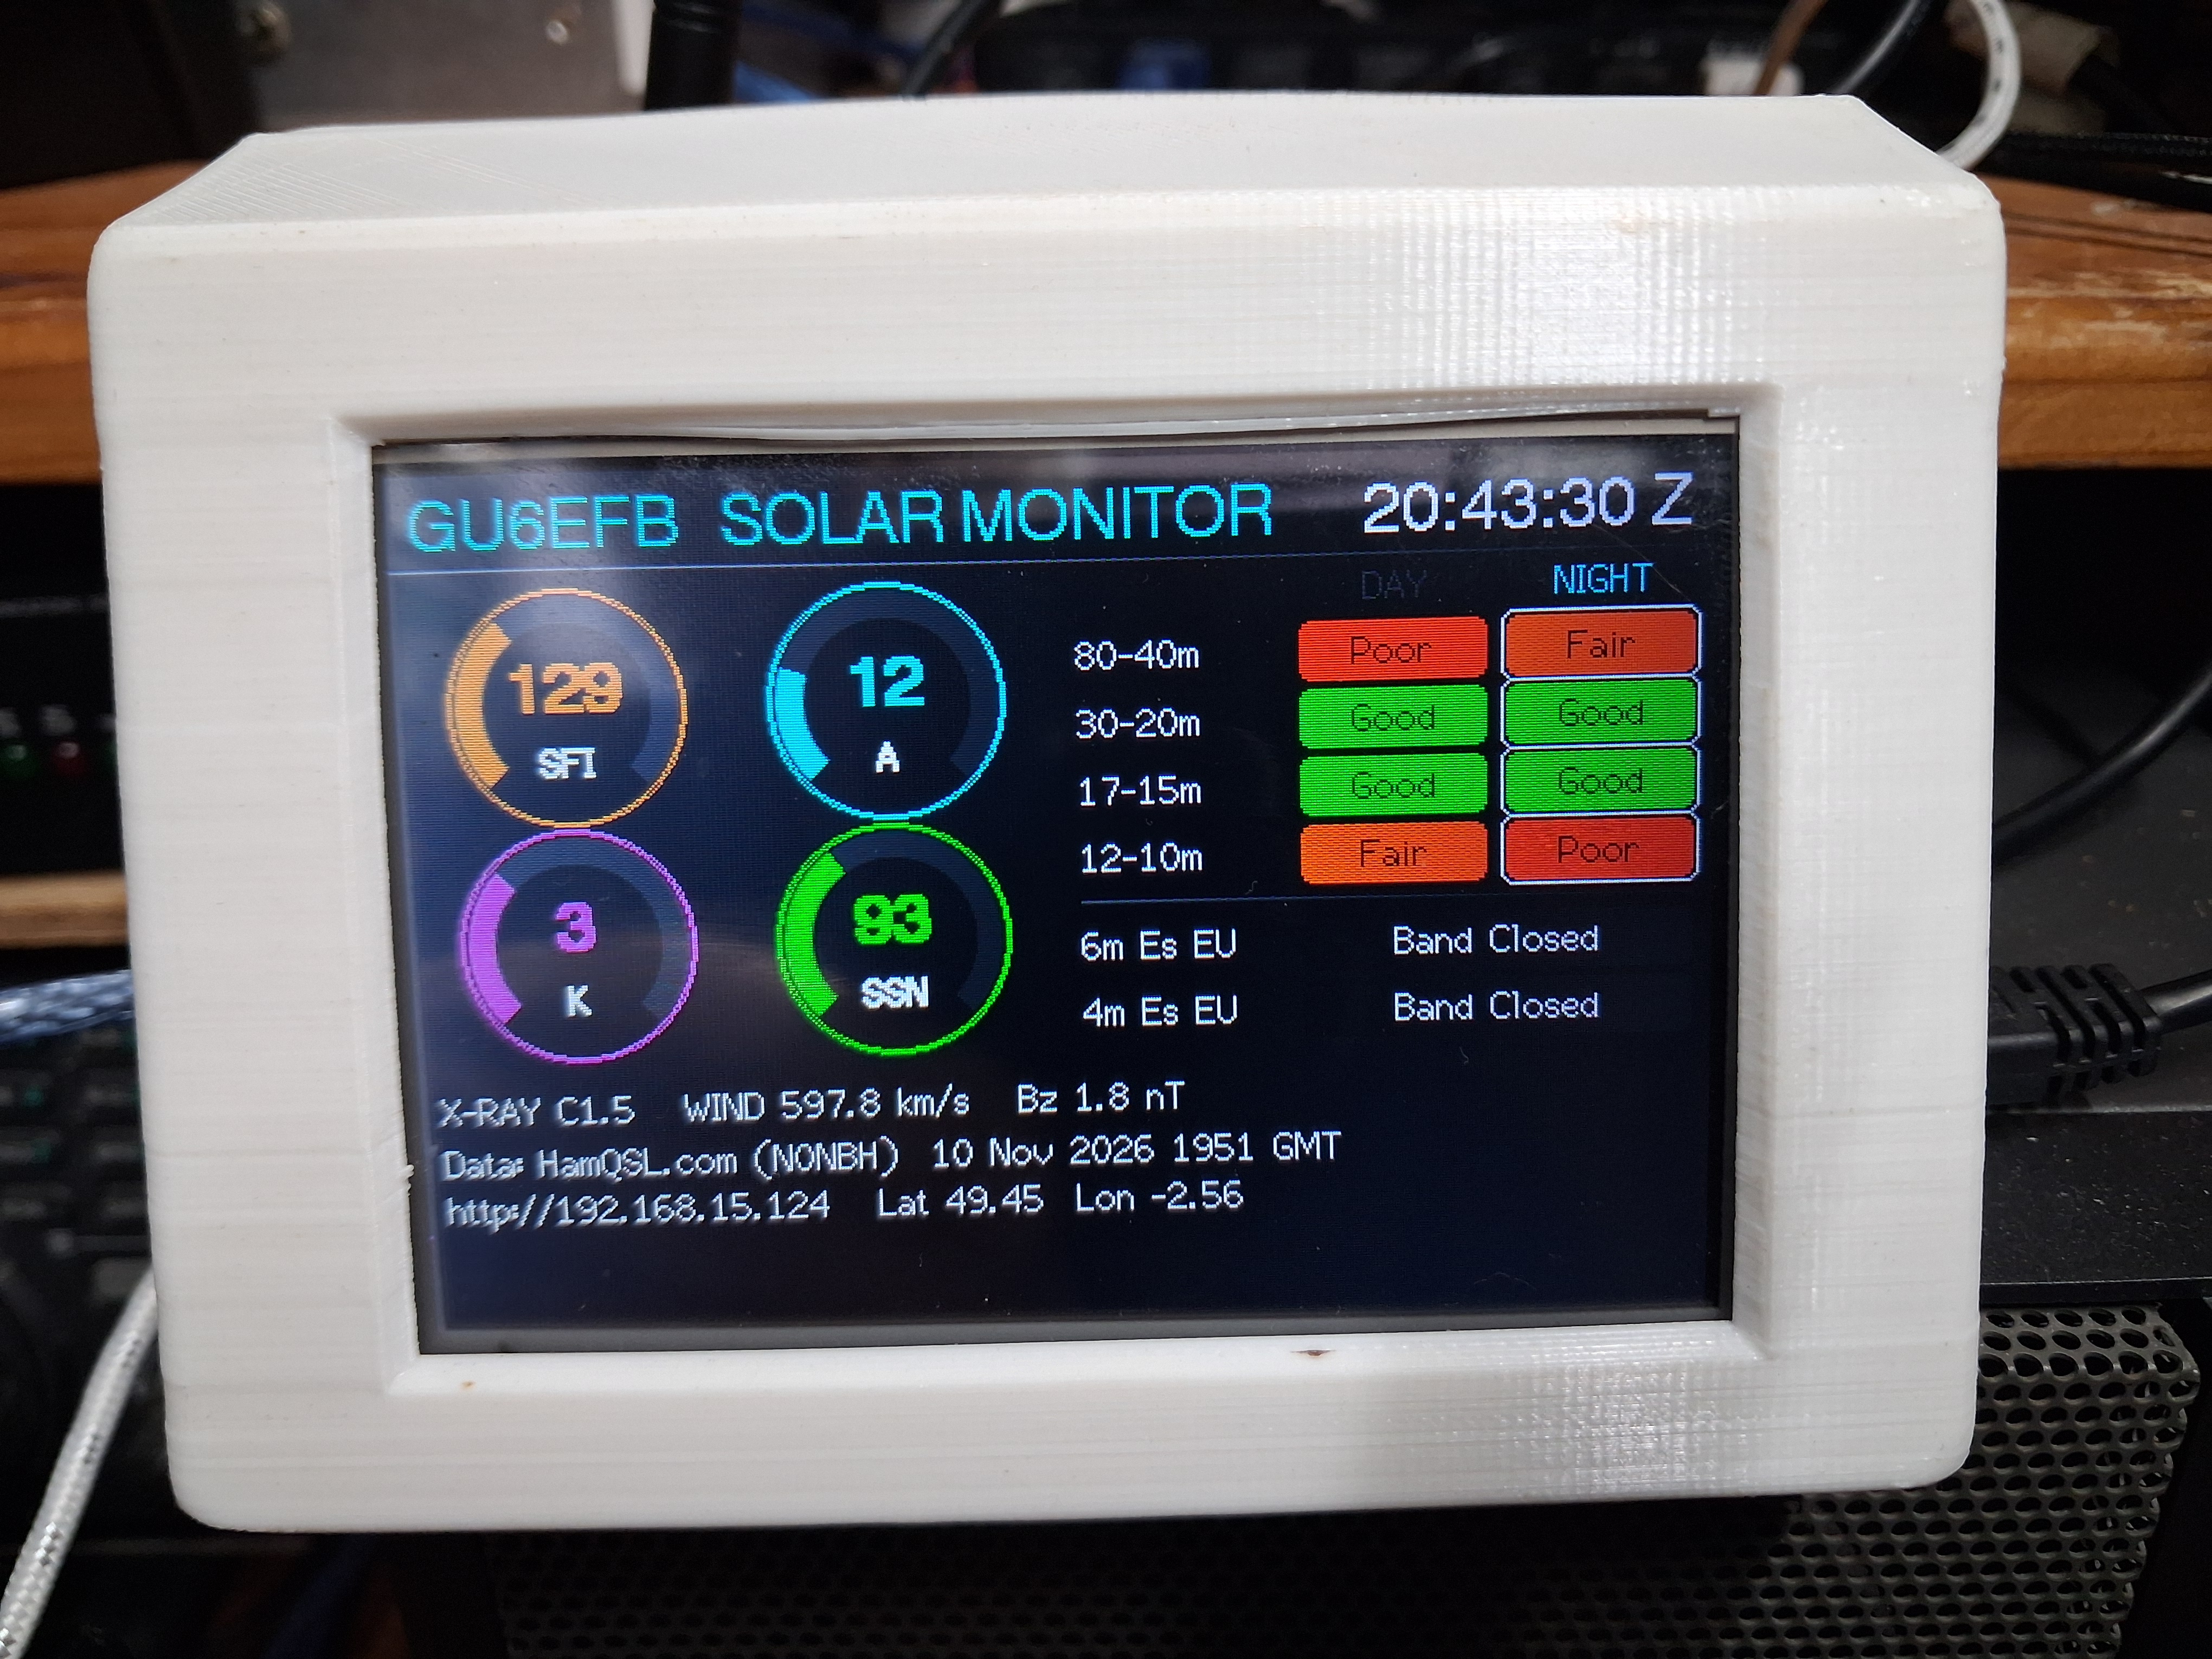
Gauges for solar flux (SFI), A-index, K-index and sunspot number. A table of HF band conditions for 80–40 m, 30–20 m, 17–15 m and 12–10 m, with the current day or night column highlighted for your location. X-ray flux, solar wind and Bz. Estimated sporadic-E for Europe on 6 m and 4 m. A red banner appears during geomagnetic storms and strong flares.
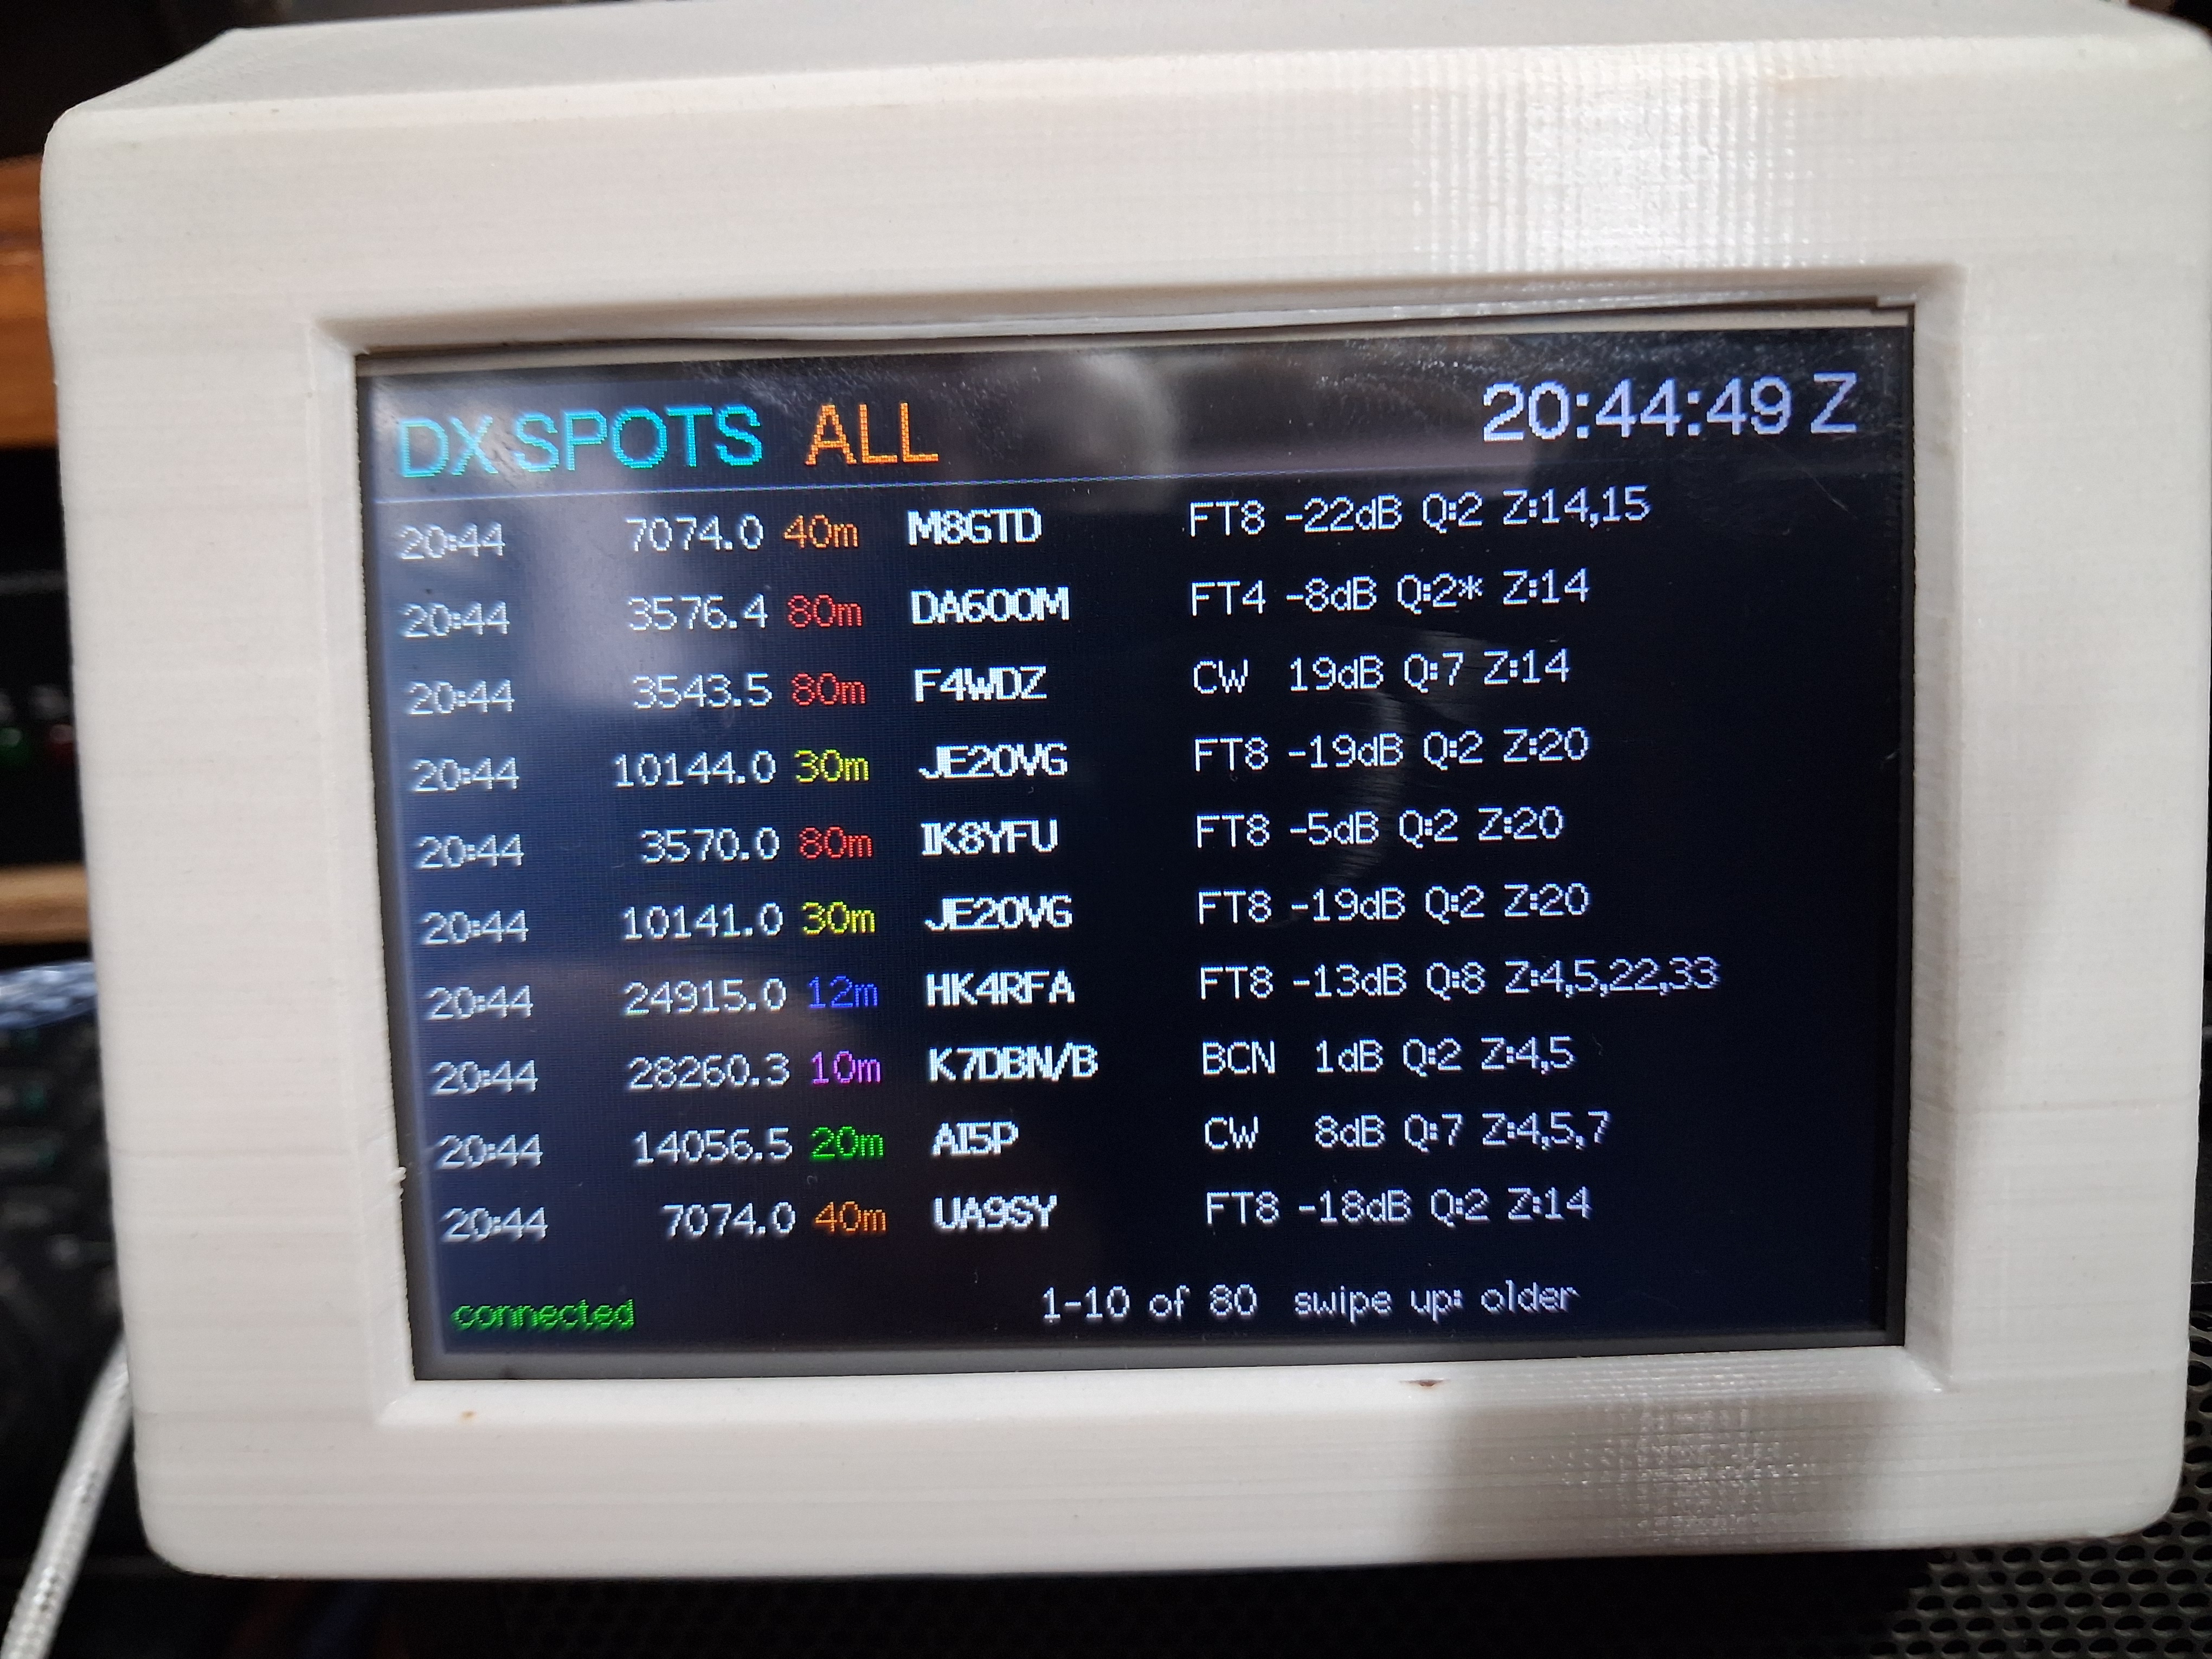
DX spots
Live spots from the GB7DXG-1 DX cluster, with the time, frequency, band, callsign and comment. Swipe up and down to scroll back through the last 80 spots. Tap the top of the screen to filter by band.
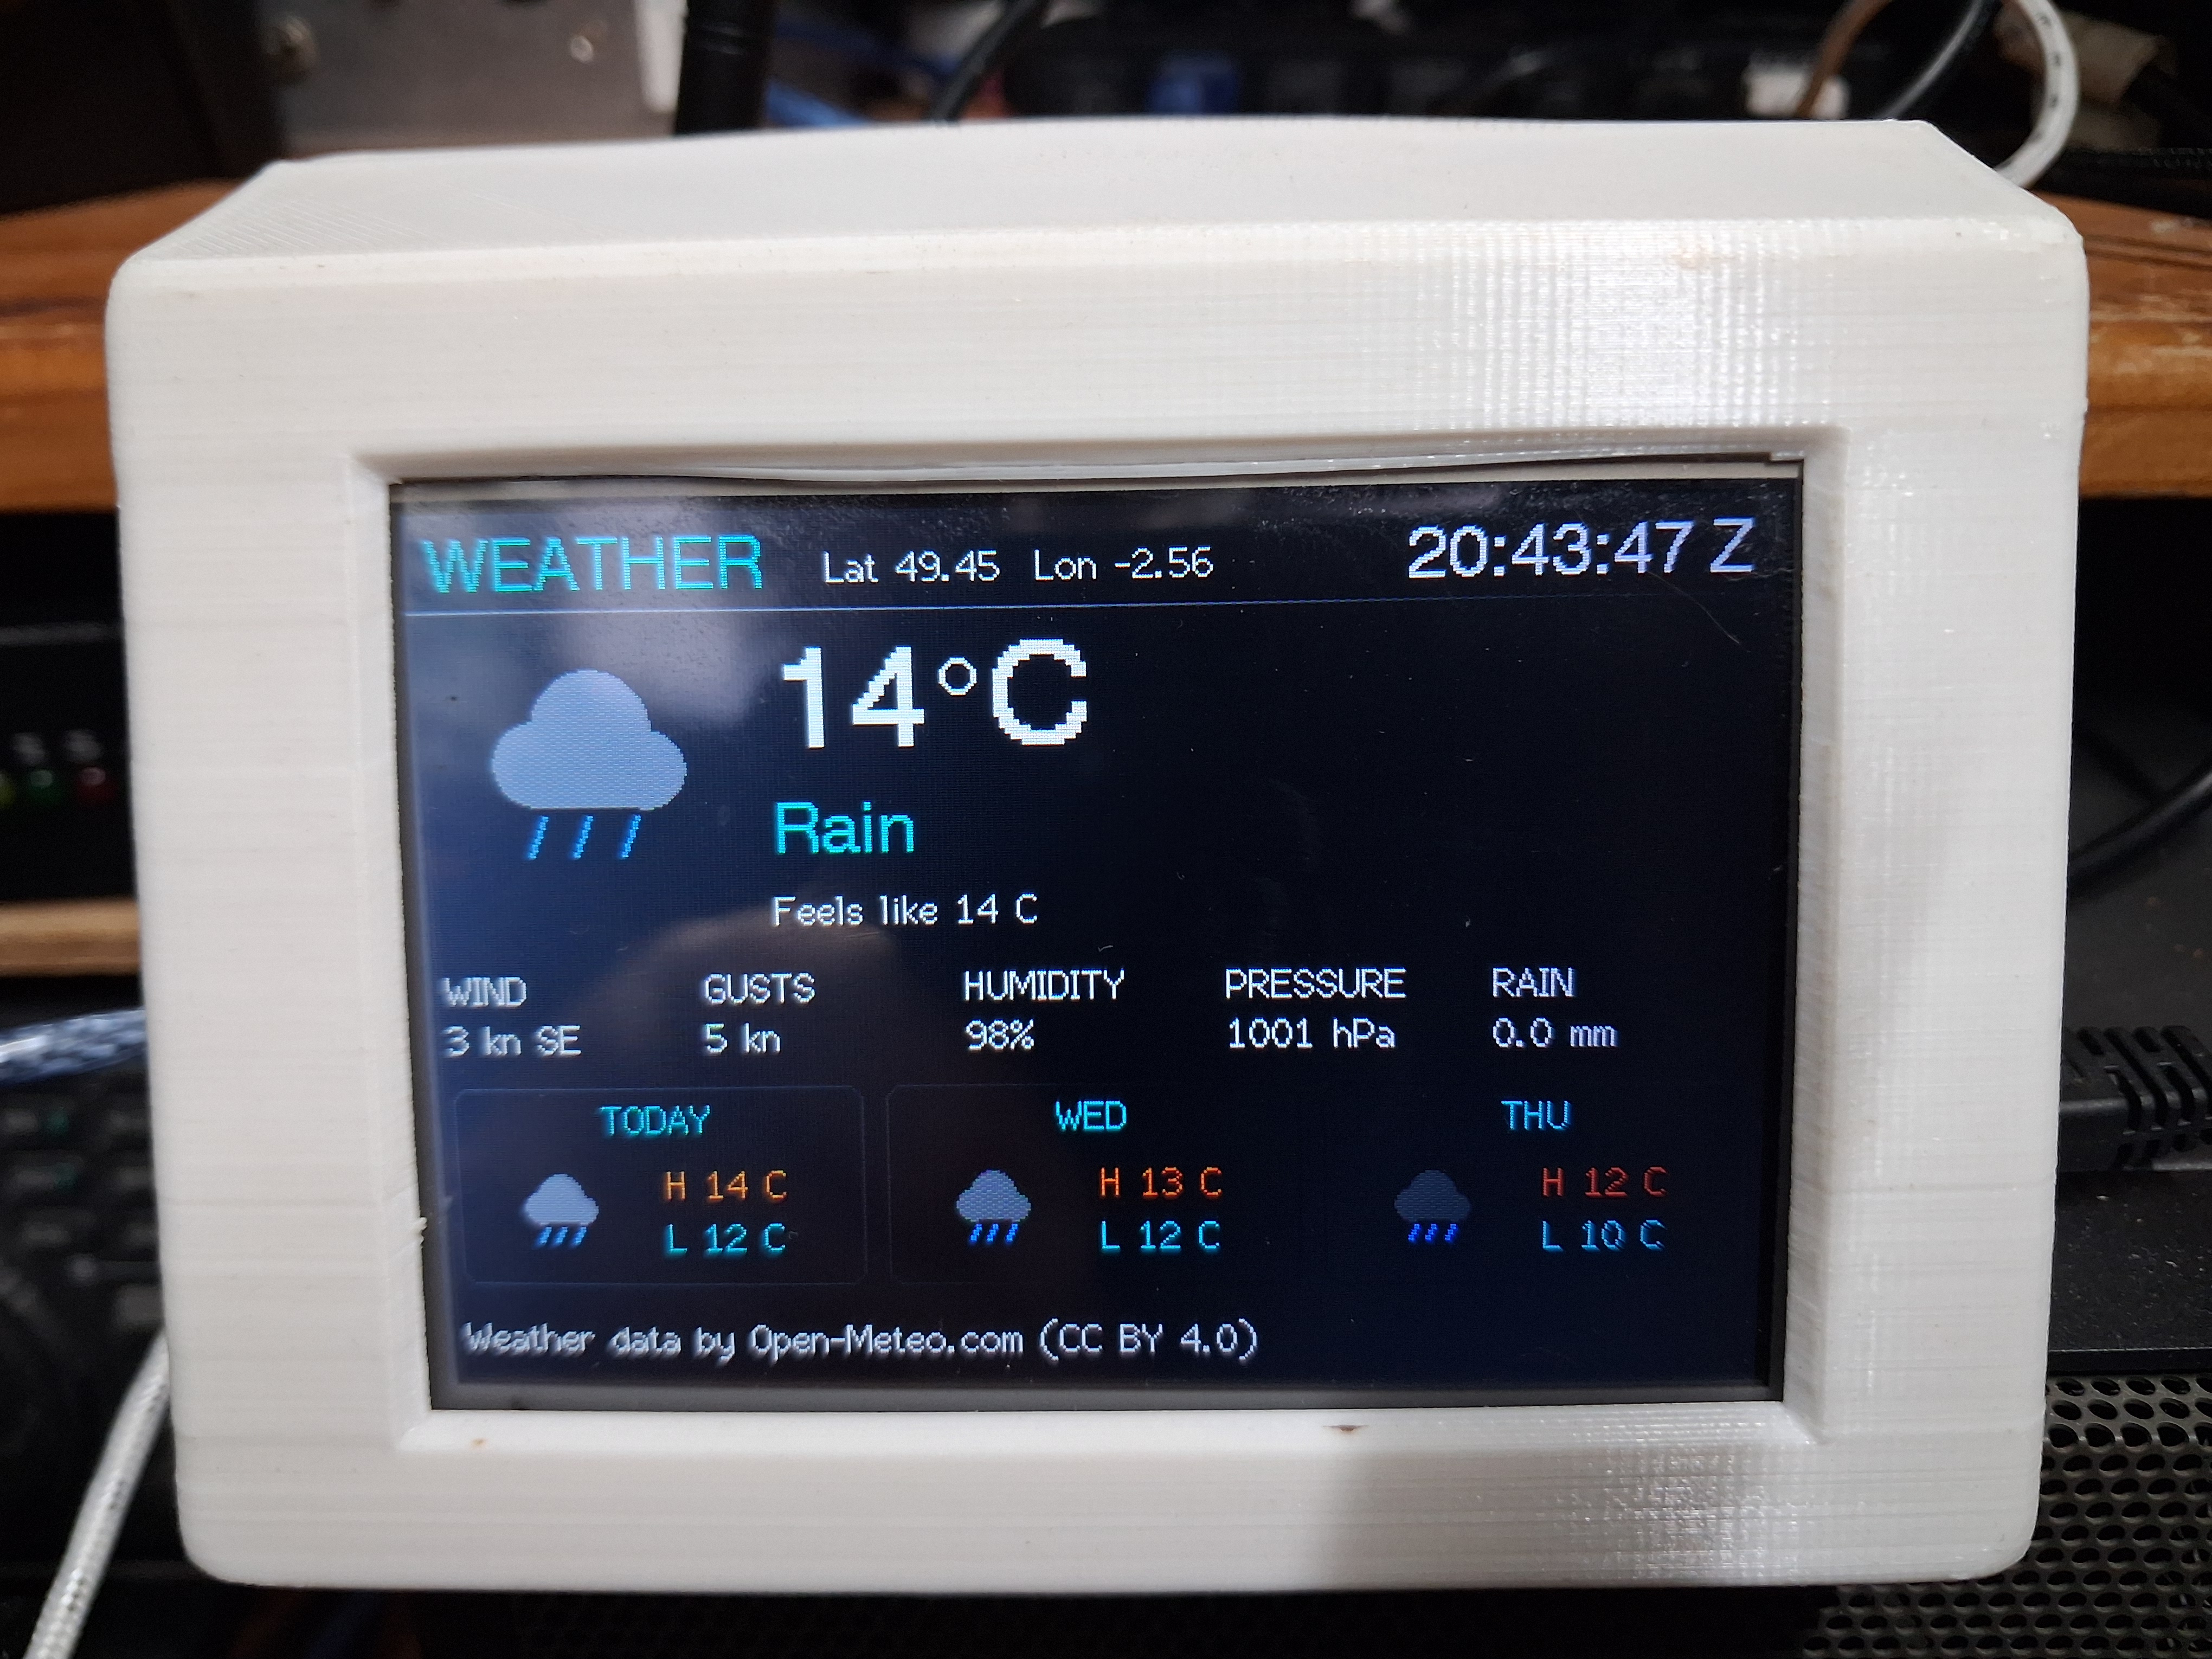
Weather
Current conditions with an icon, temperature, wind in knots, gusts, humidity, pressure and rain, plus a three-day forecast.
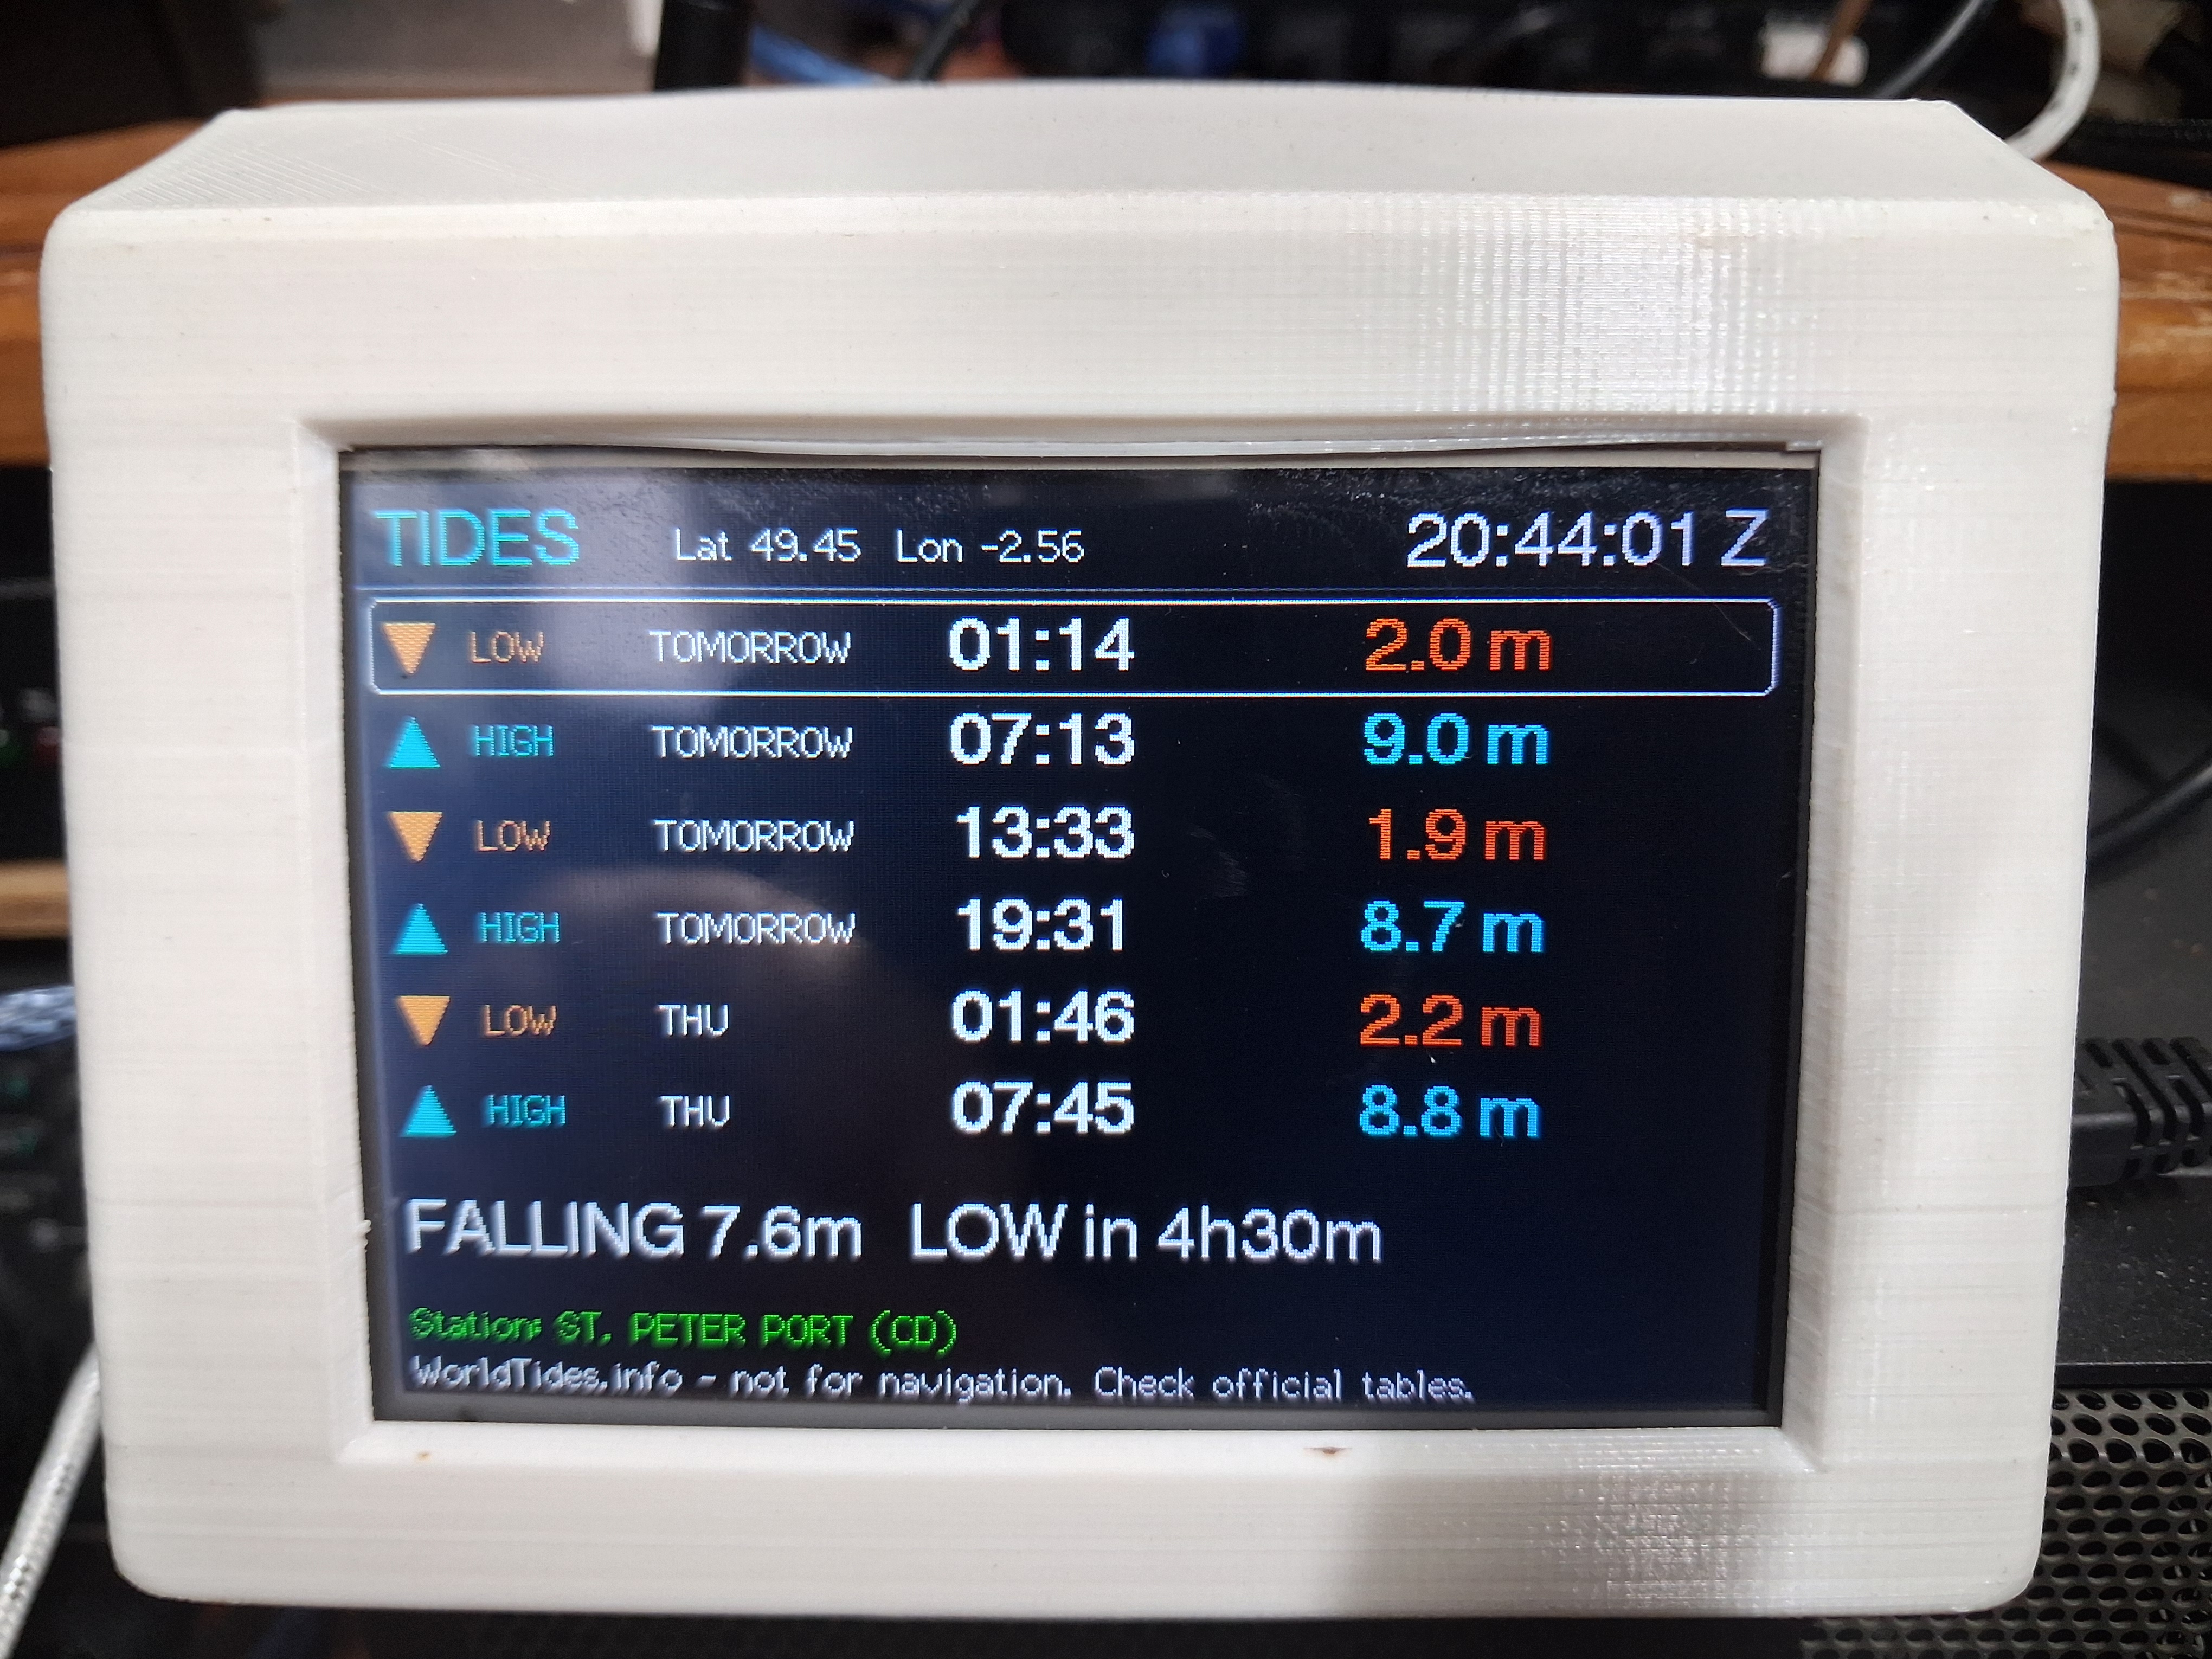
Tides
The next high and low tides with a rising or falling countdown. See the note on accuracy below, because this is an estimate unless you add an optional tide-data key.
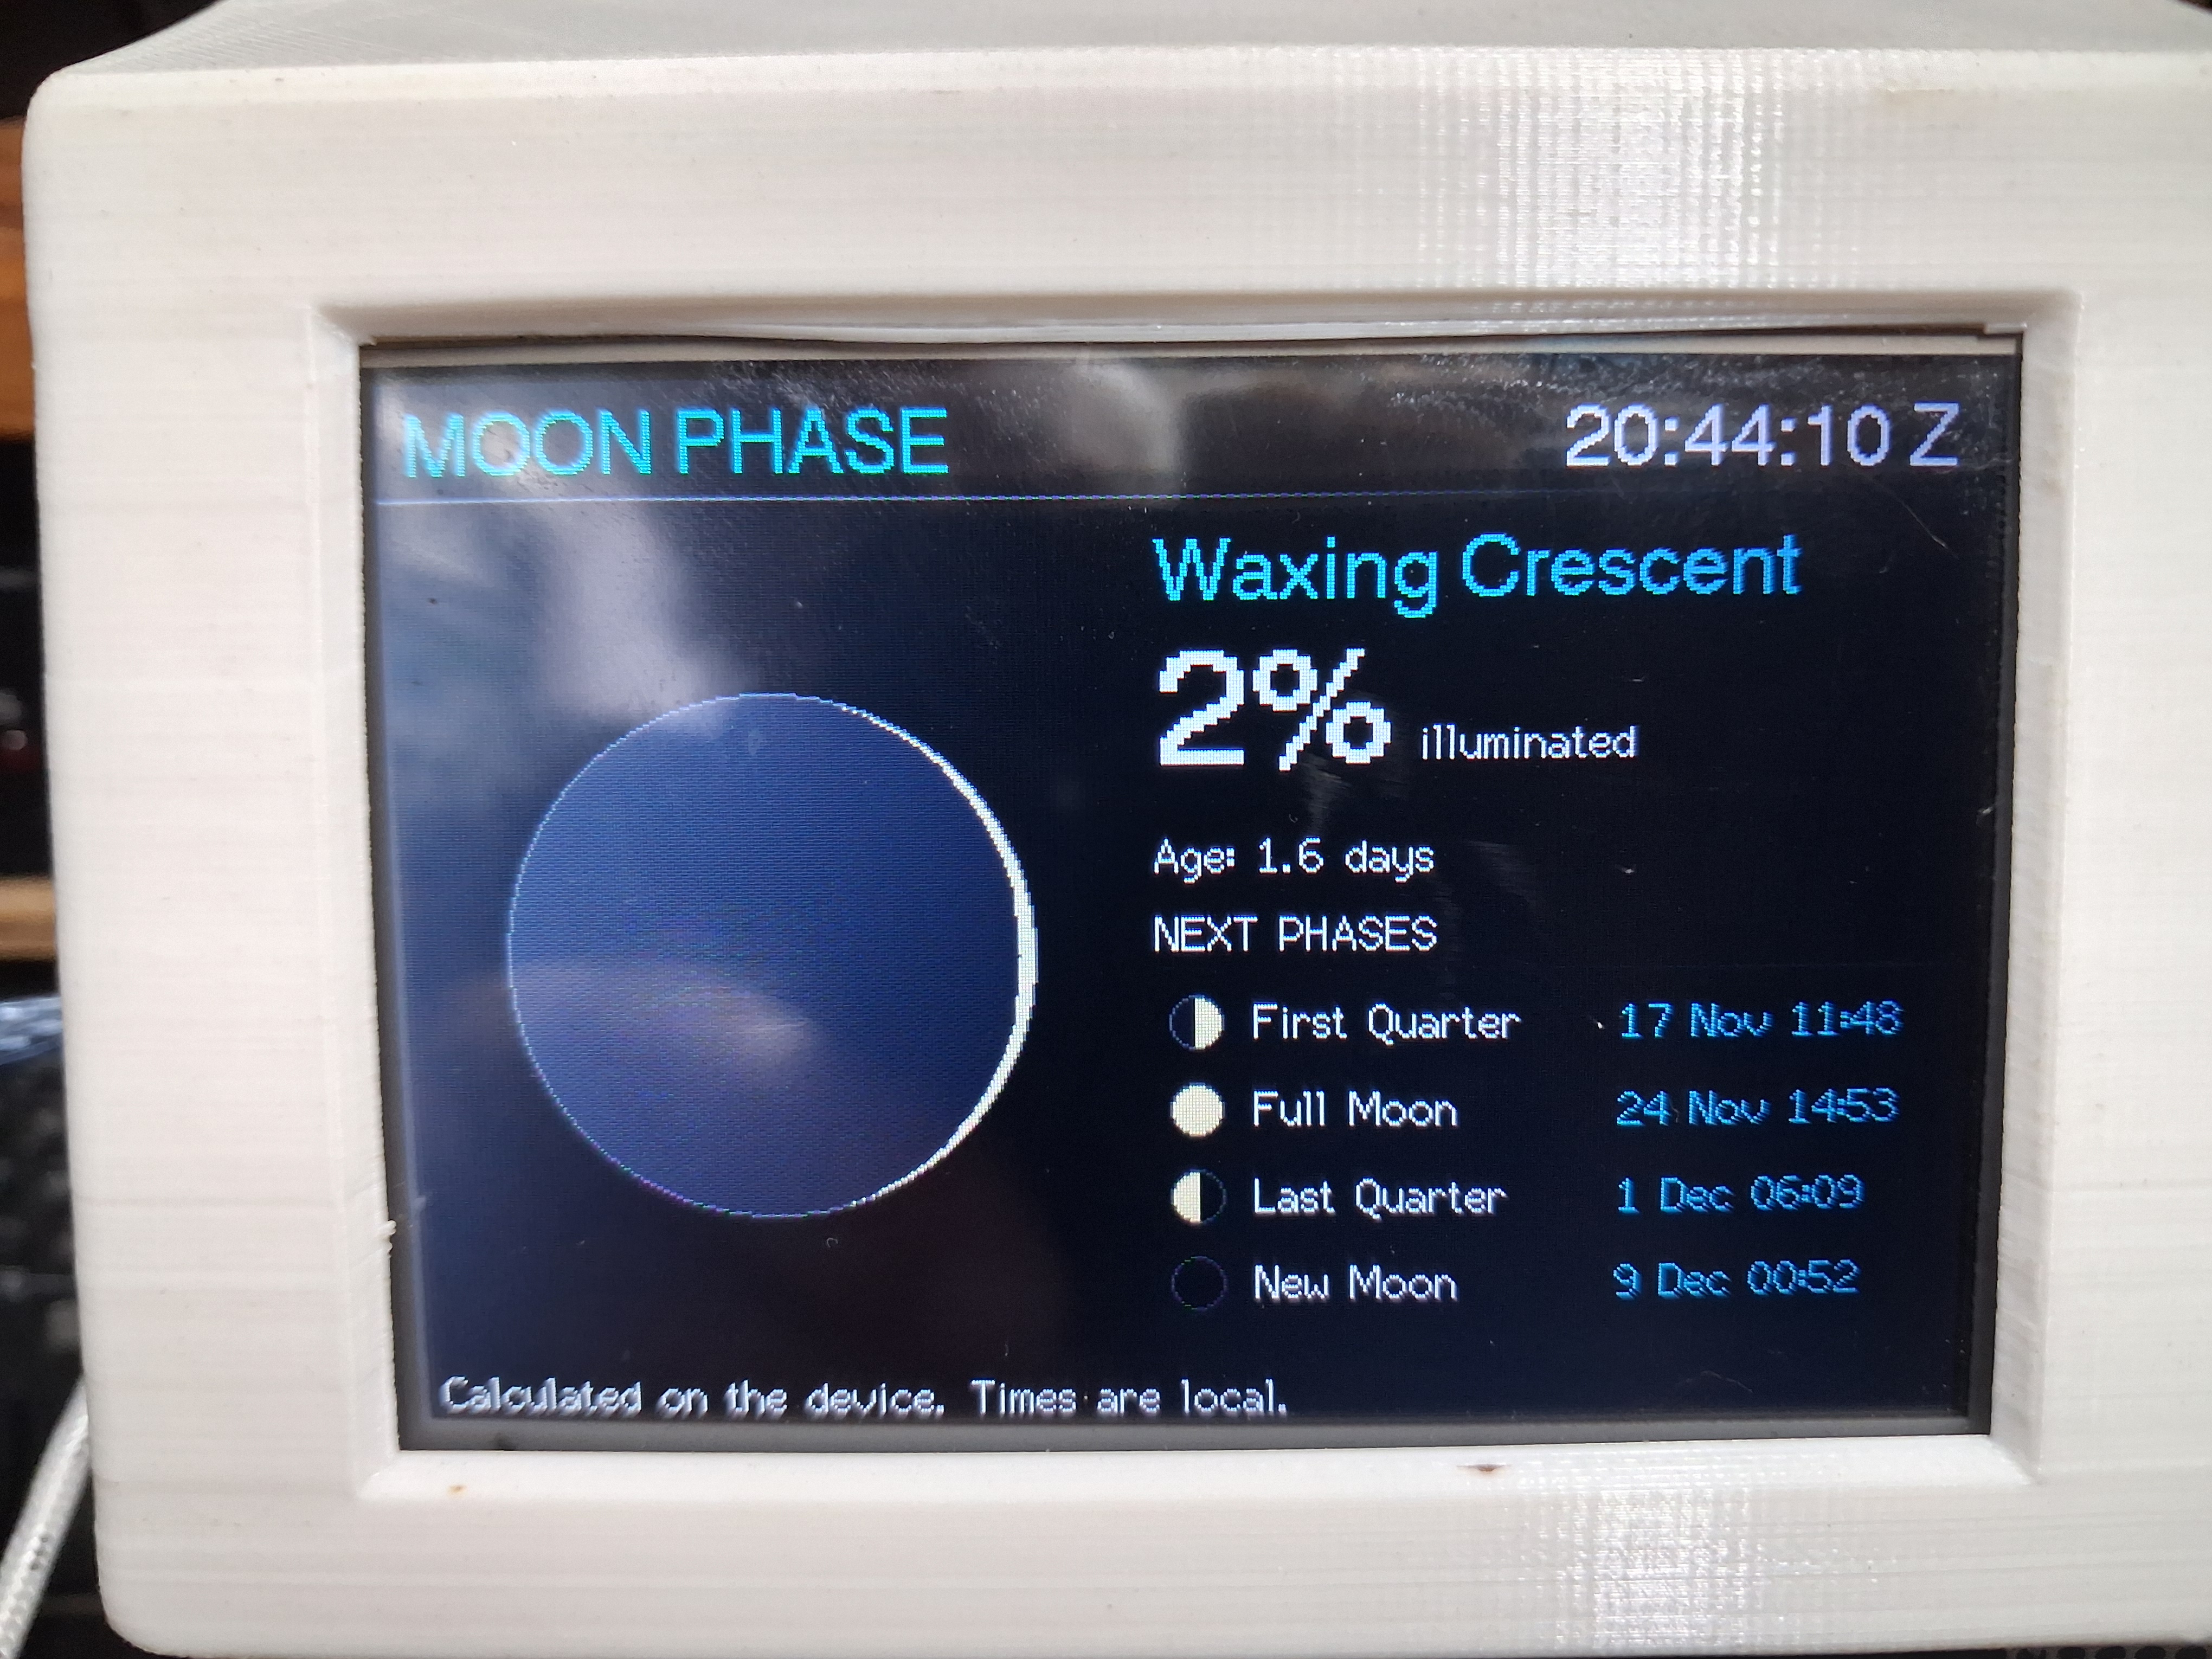
Moon
A picture of the current phase, the percentage lit, the moon’s age and the date and time of the next four phases.
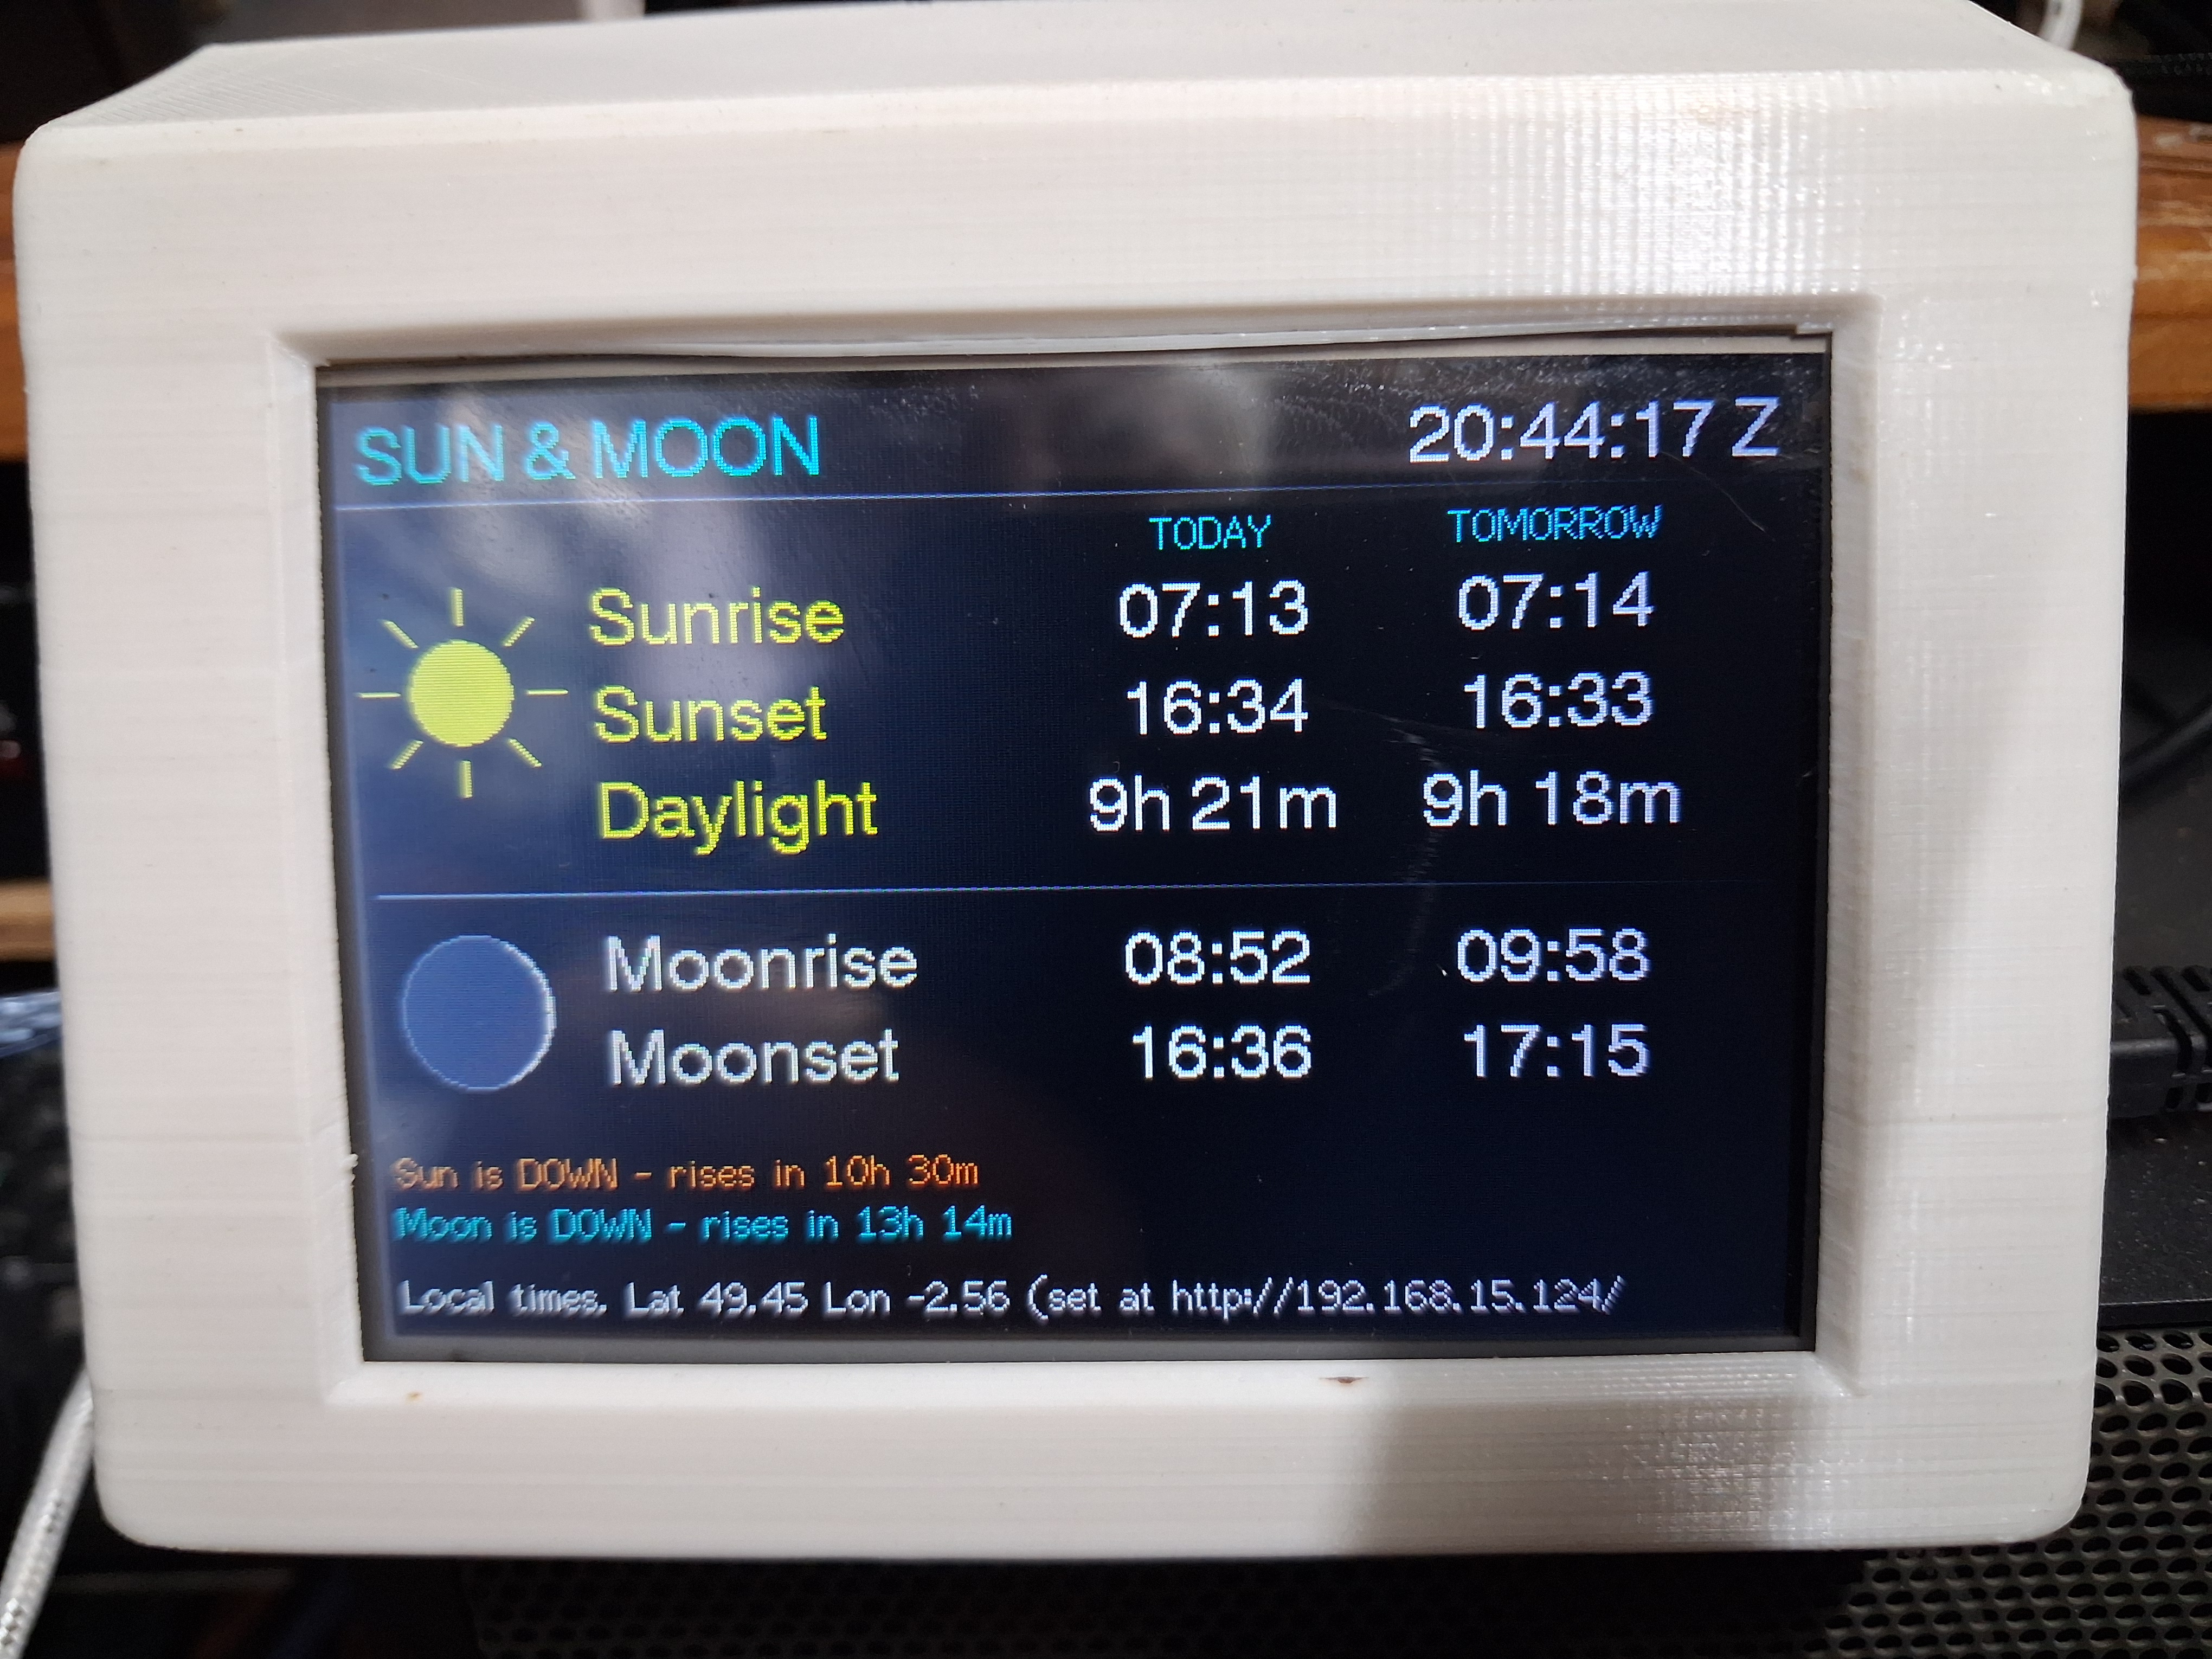
Sun & Moon
Sunrise, sunset, daylight length, moonrise and moonset for today and tomorrow at your location, with a live “up or down” status for each.
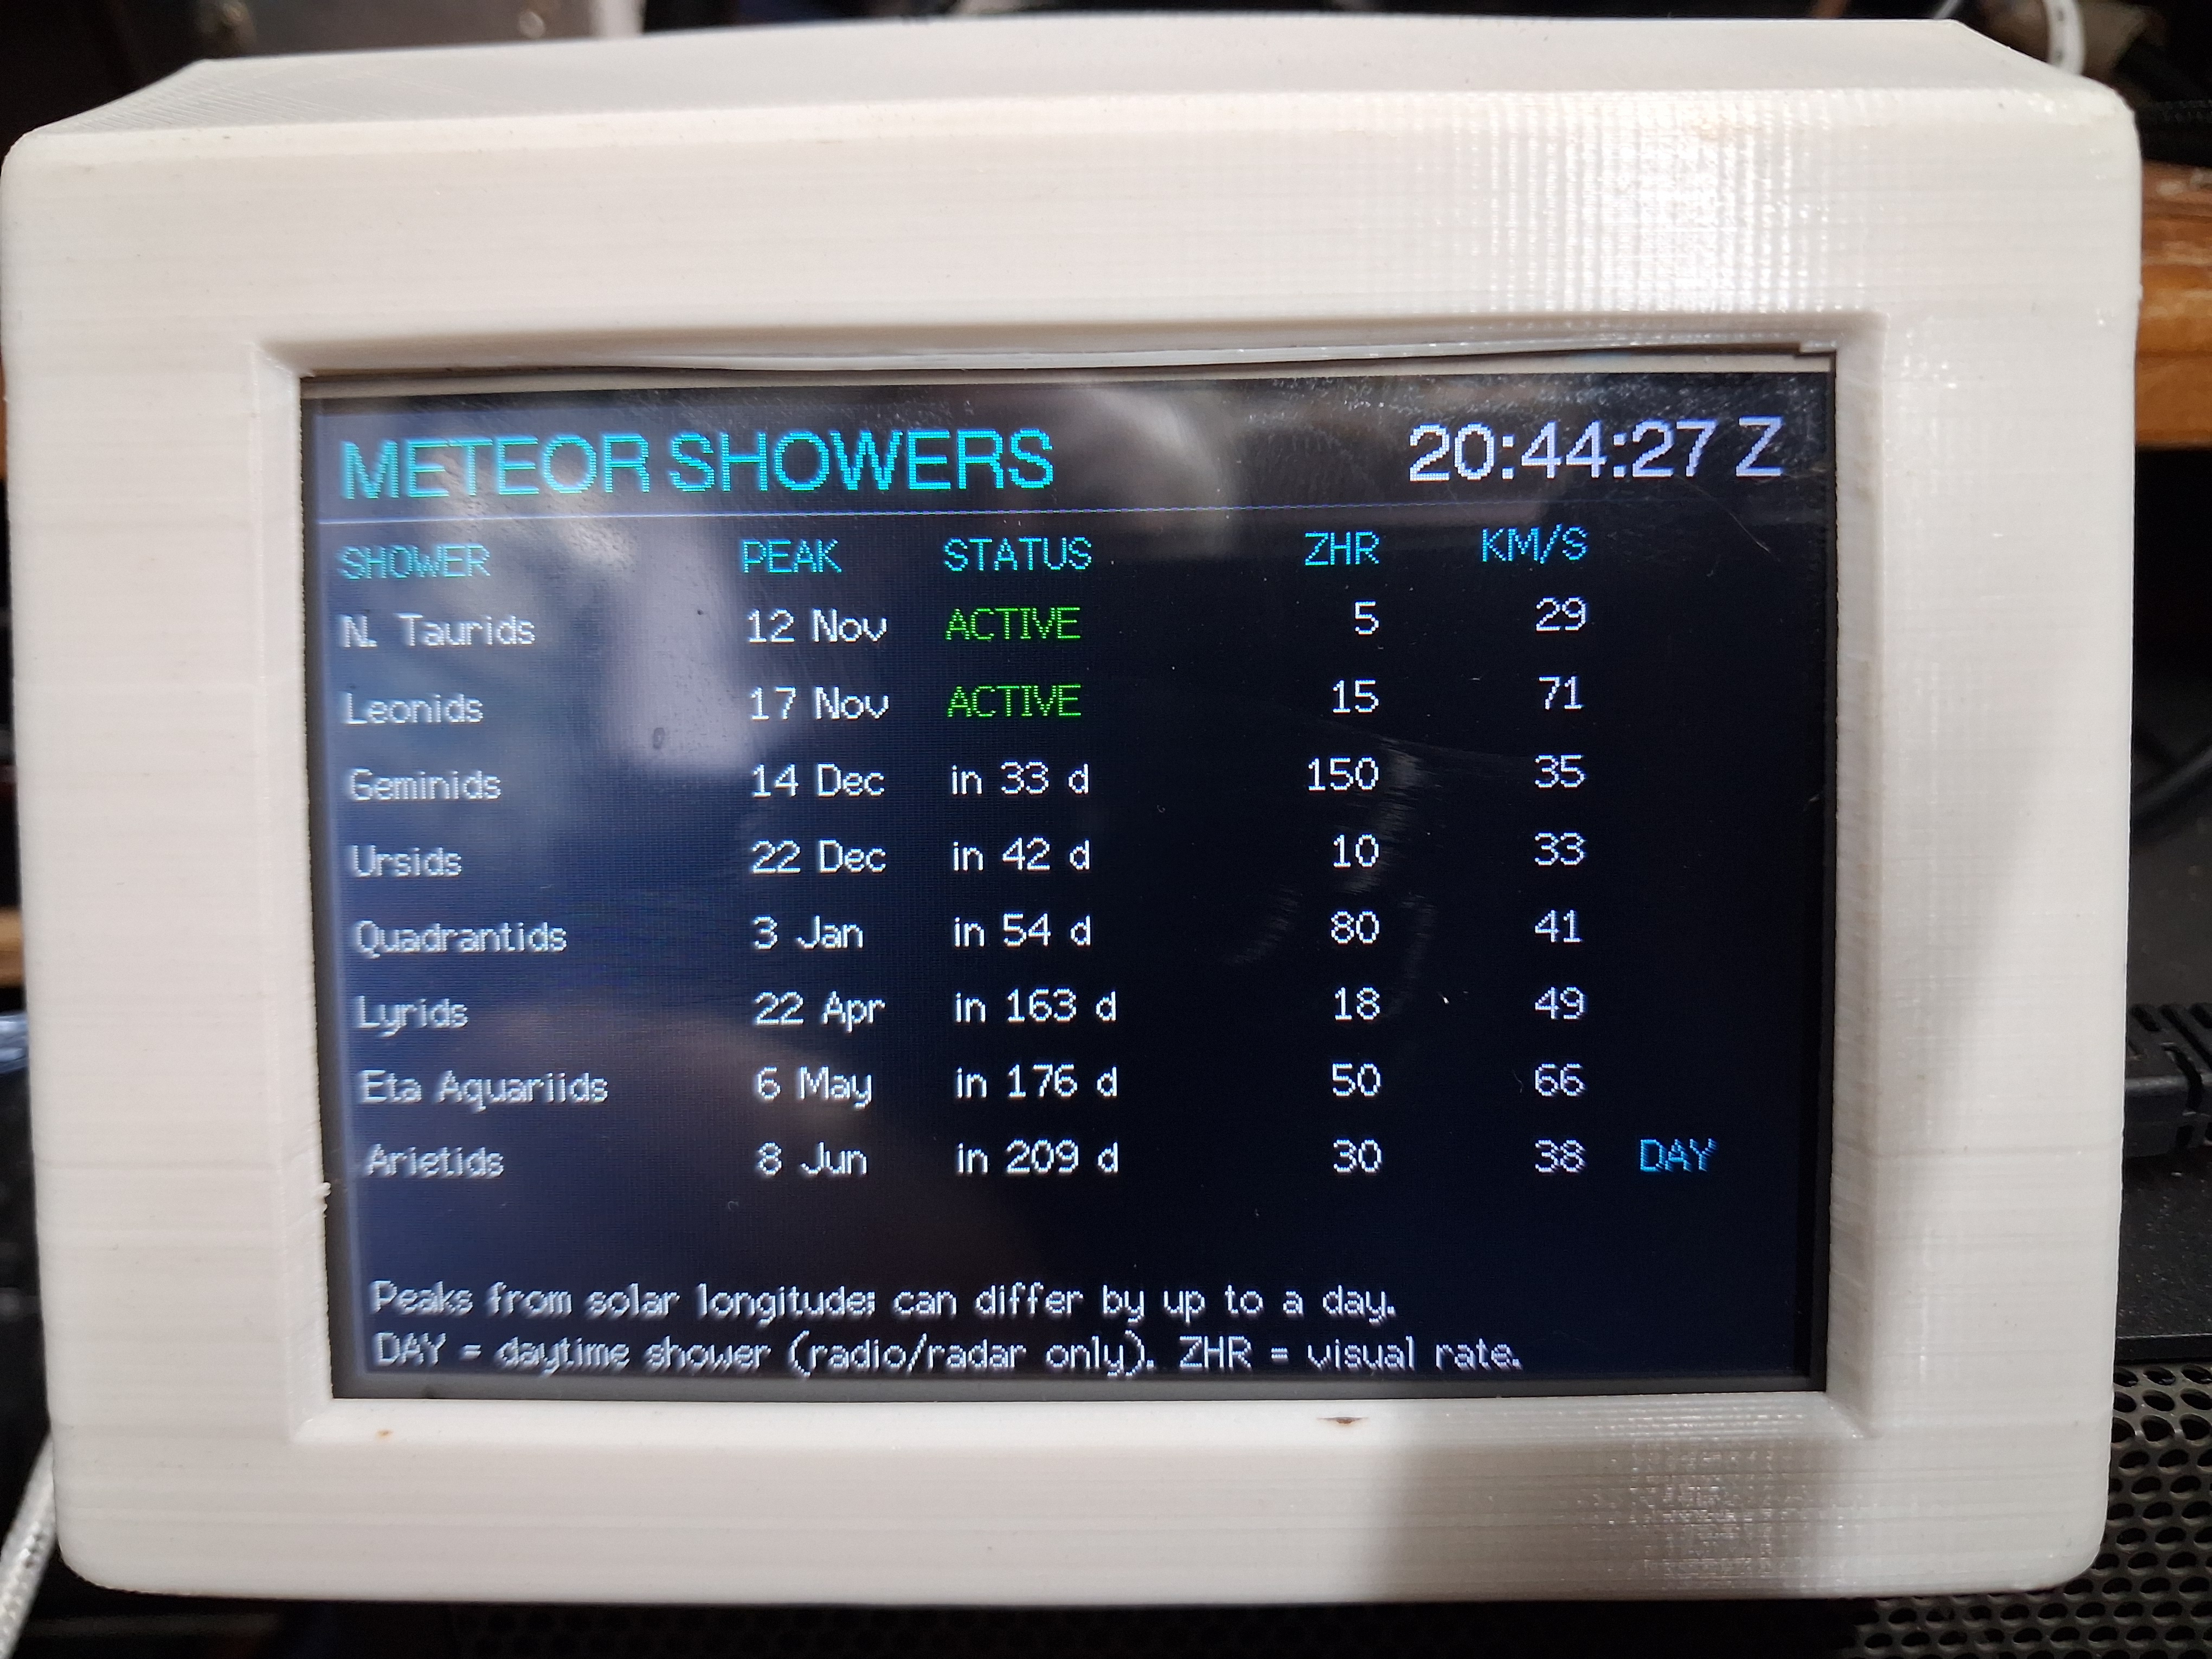
Meteor showers
The next eight shower peaks with their typical rates and speeds. Daytime showers that only radio can detect are marked.
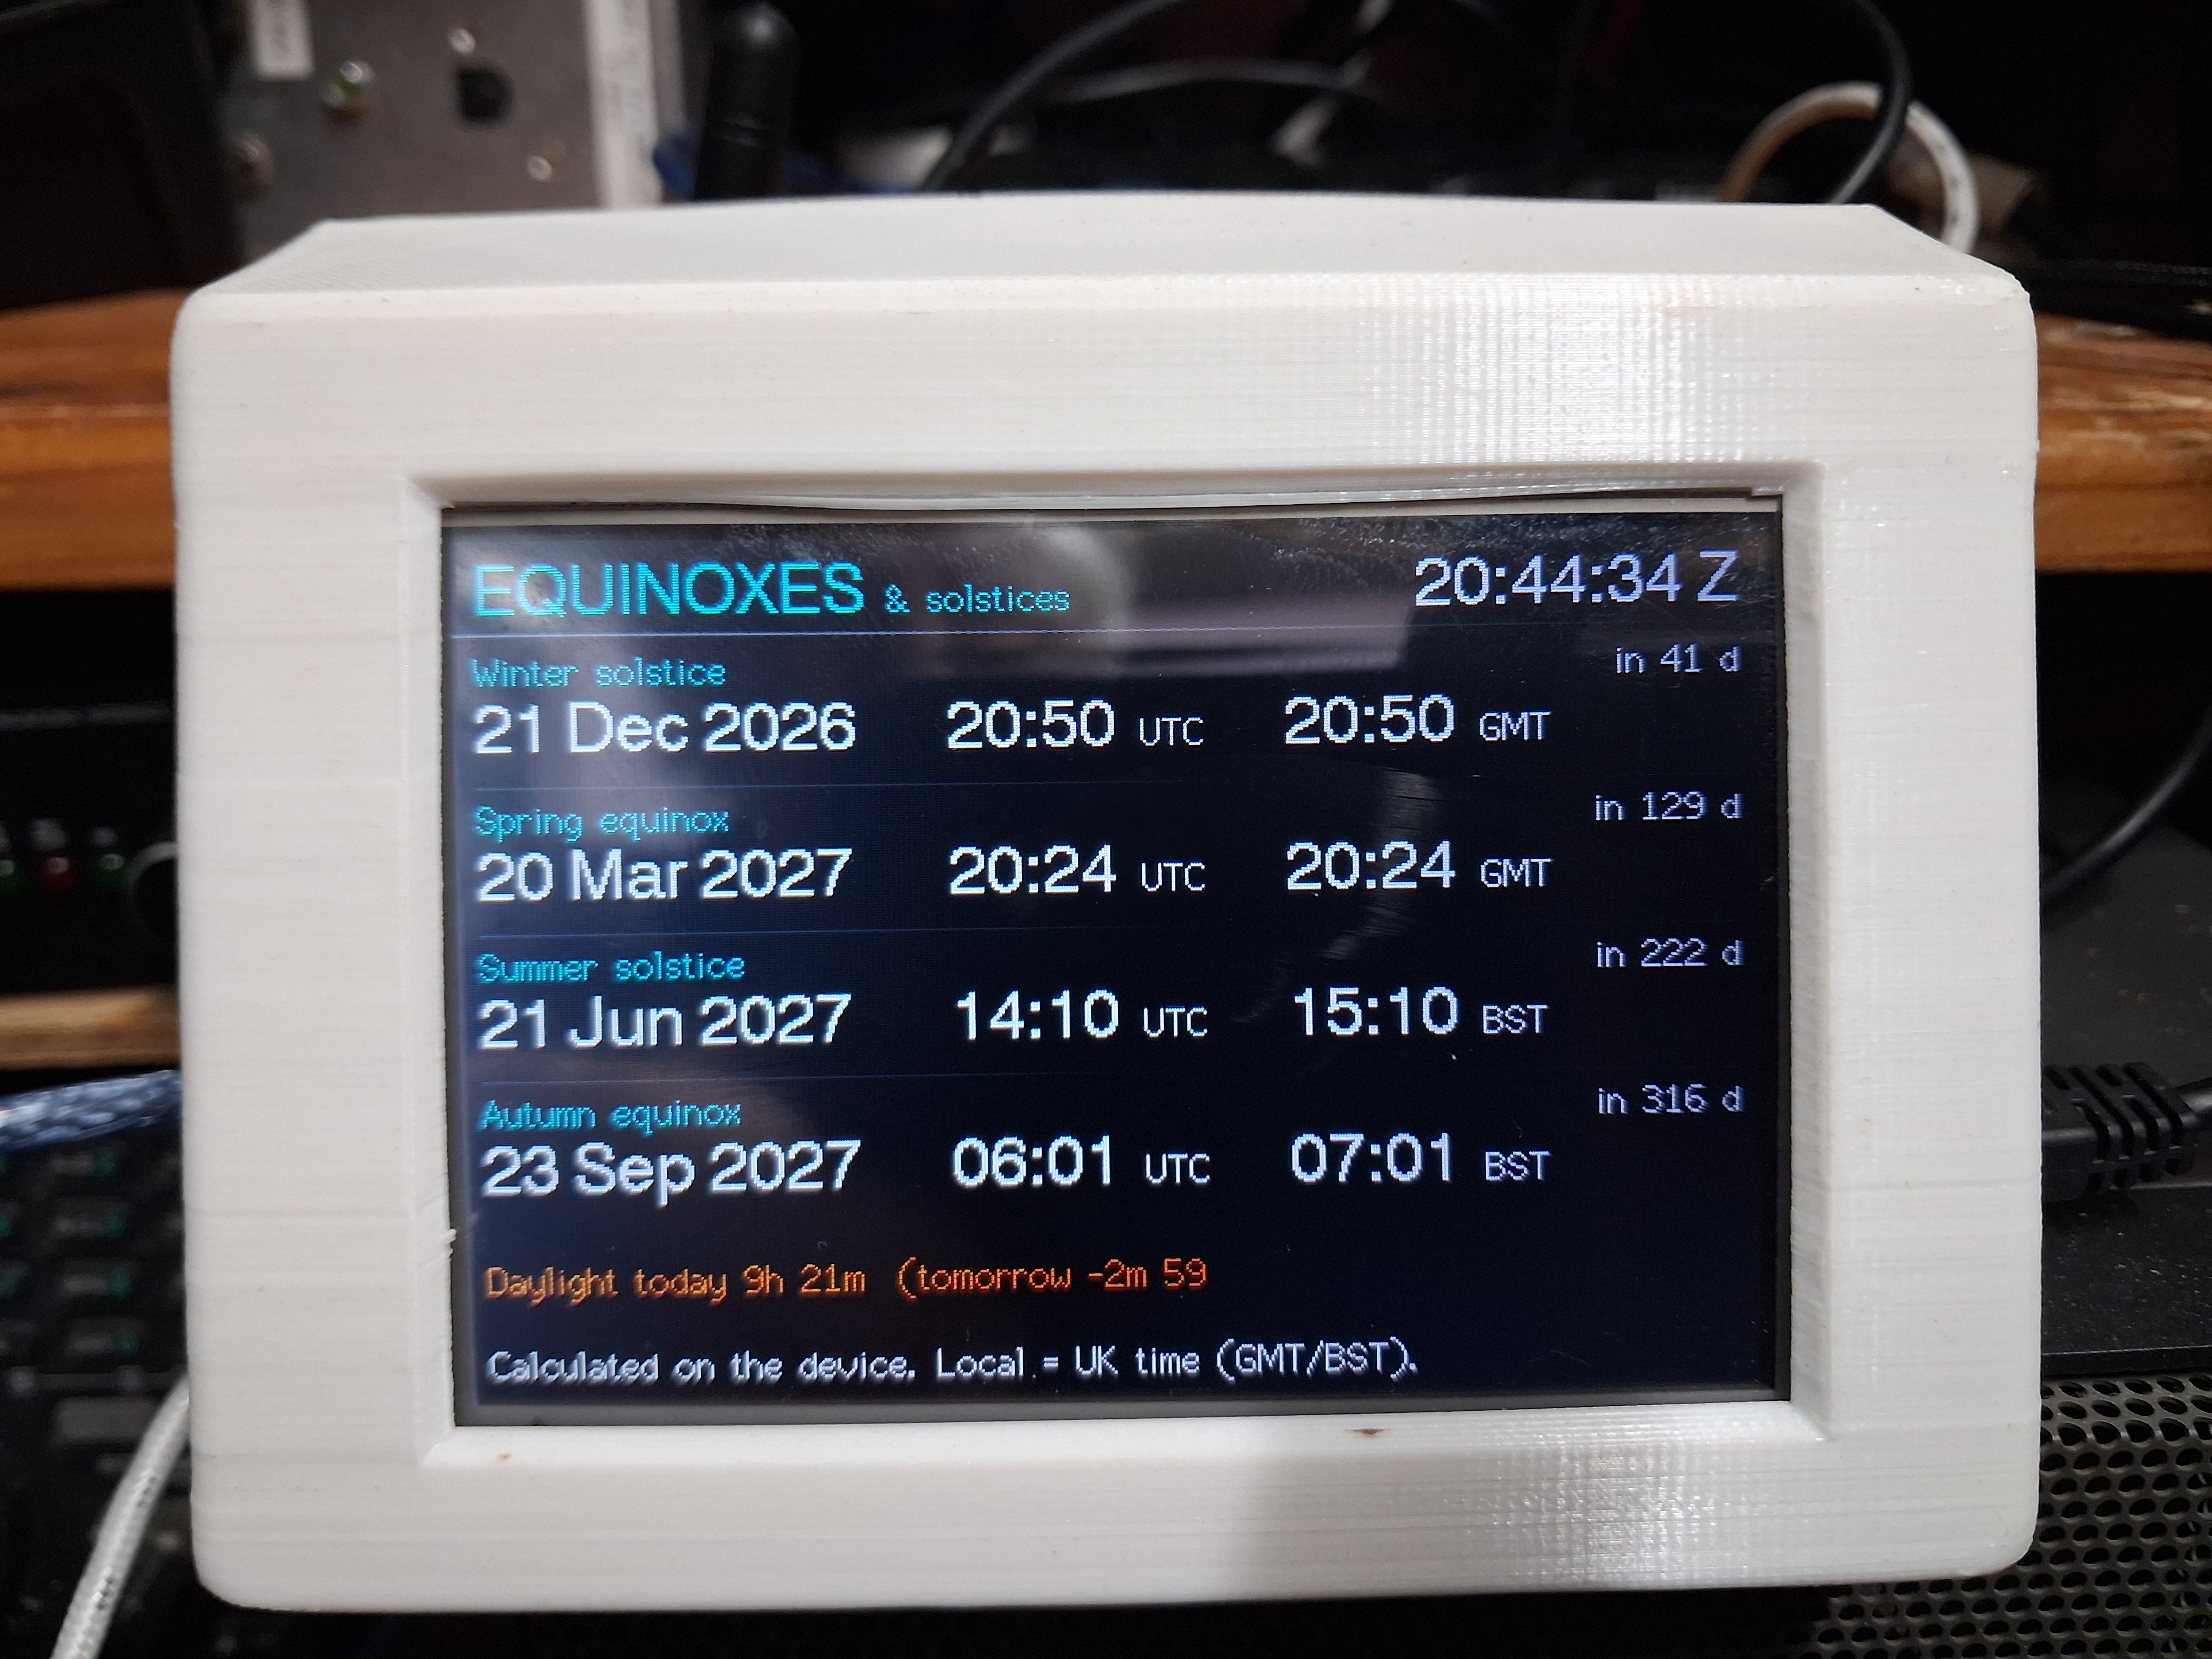
Equinoxes
The next four equinoxes and solstices in UTC and local time, with a countdown, plus how fast the daylight is changing.
Photos
Where the information comes from
Everything is fetched over Wi-Fi from free public sources, or worked out on the unit itself. Nothing needs a computer left running.
| Page | Source | Refreshed |
|---|---|---|
| Solar, band conditions, 6 m / 4 m sporadic-E | HamQSL.com solar data feed (N0NBH) | Hourly |
| Weather | Open-Meteo.com | Every 15 minutes |
| Tides | Open-Meteo marine model, or WorldTides.info if you add a key | Every 6 hours (model) or daily (WorldTides) |
| DX spots | The GB7DXG-1 DX cluster, over a telnet connection | Live |
| Moon, sun, equinoxes | Calculated on the unit using standard astronomical formulas (Jean Meeus, Astronomical Algorithms) | On the unit, no internet needed |
| Meteor showers | A built-in calendar based on the International Meteor Organization’s shower list, with peak dates worked out for the current year | On the unit |
How it’s built
The hardware
There are only two main parts, joined by about a dozen wires.
Parts
- An ESP32 module with an external antenna connection (ESP32U), on a development board with USB.
- A 3.5″ 480 × 320 colour display with an ILI9488 controller and an XPT2046 touch controller, both on the same SPI connection.
- A USB cable and a 5 V USB power supply.
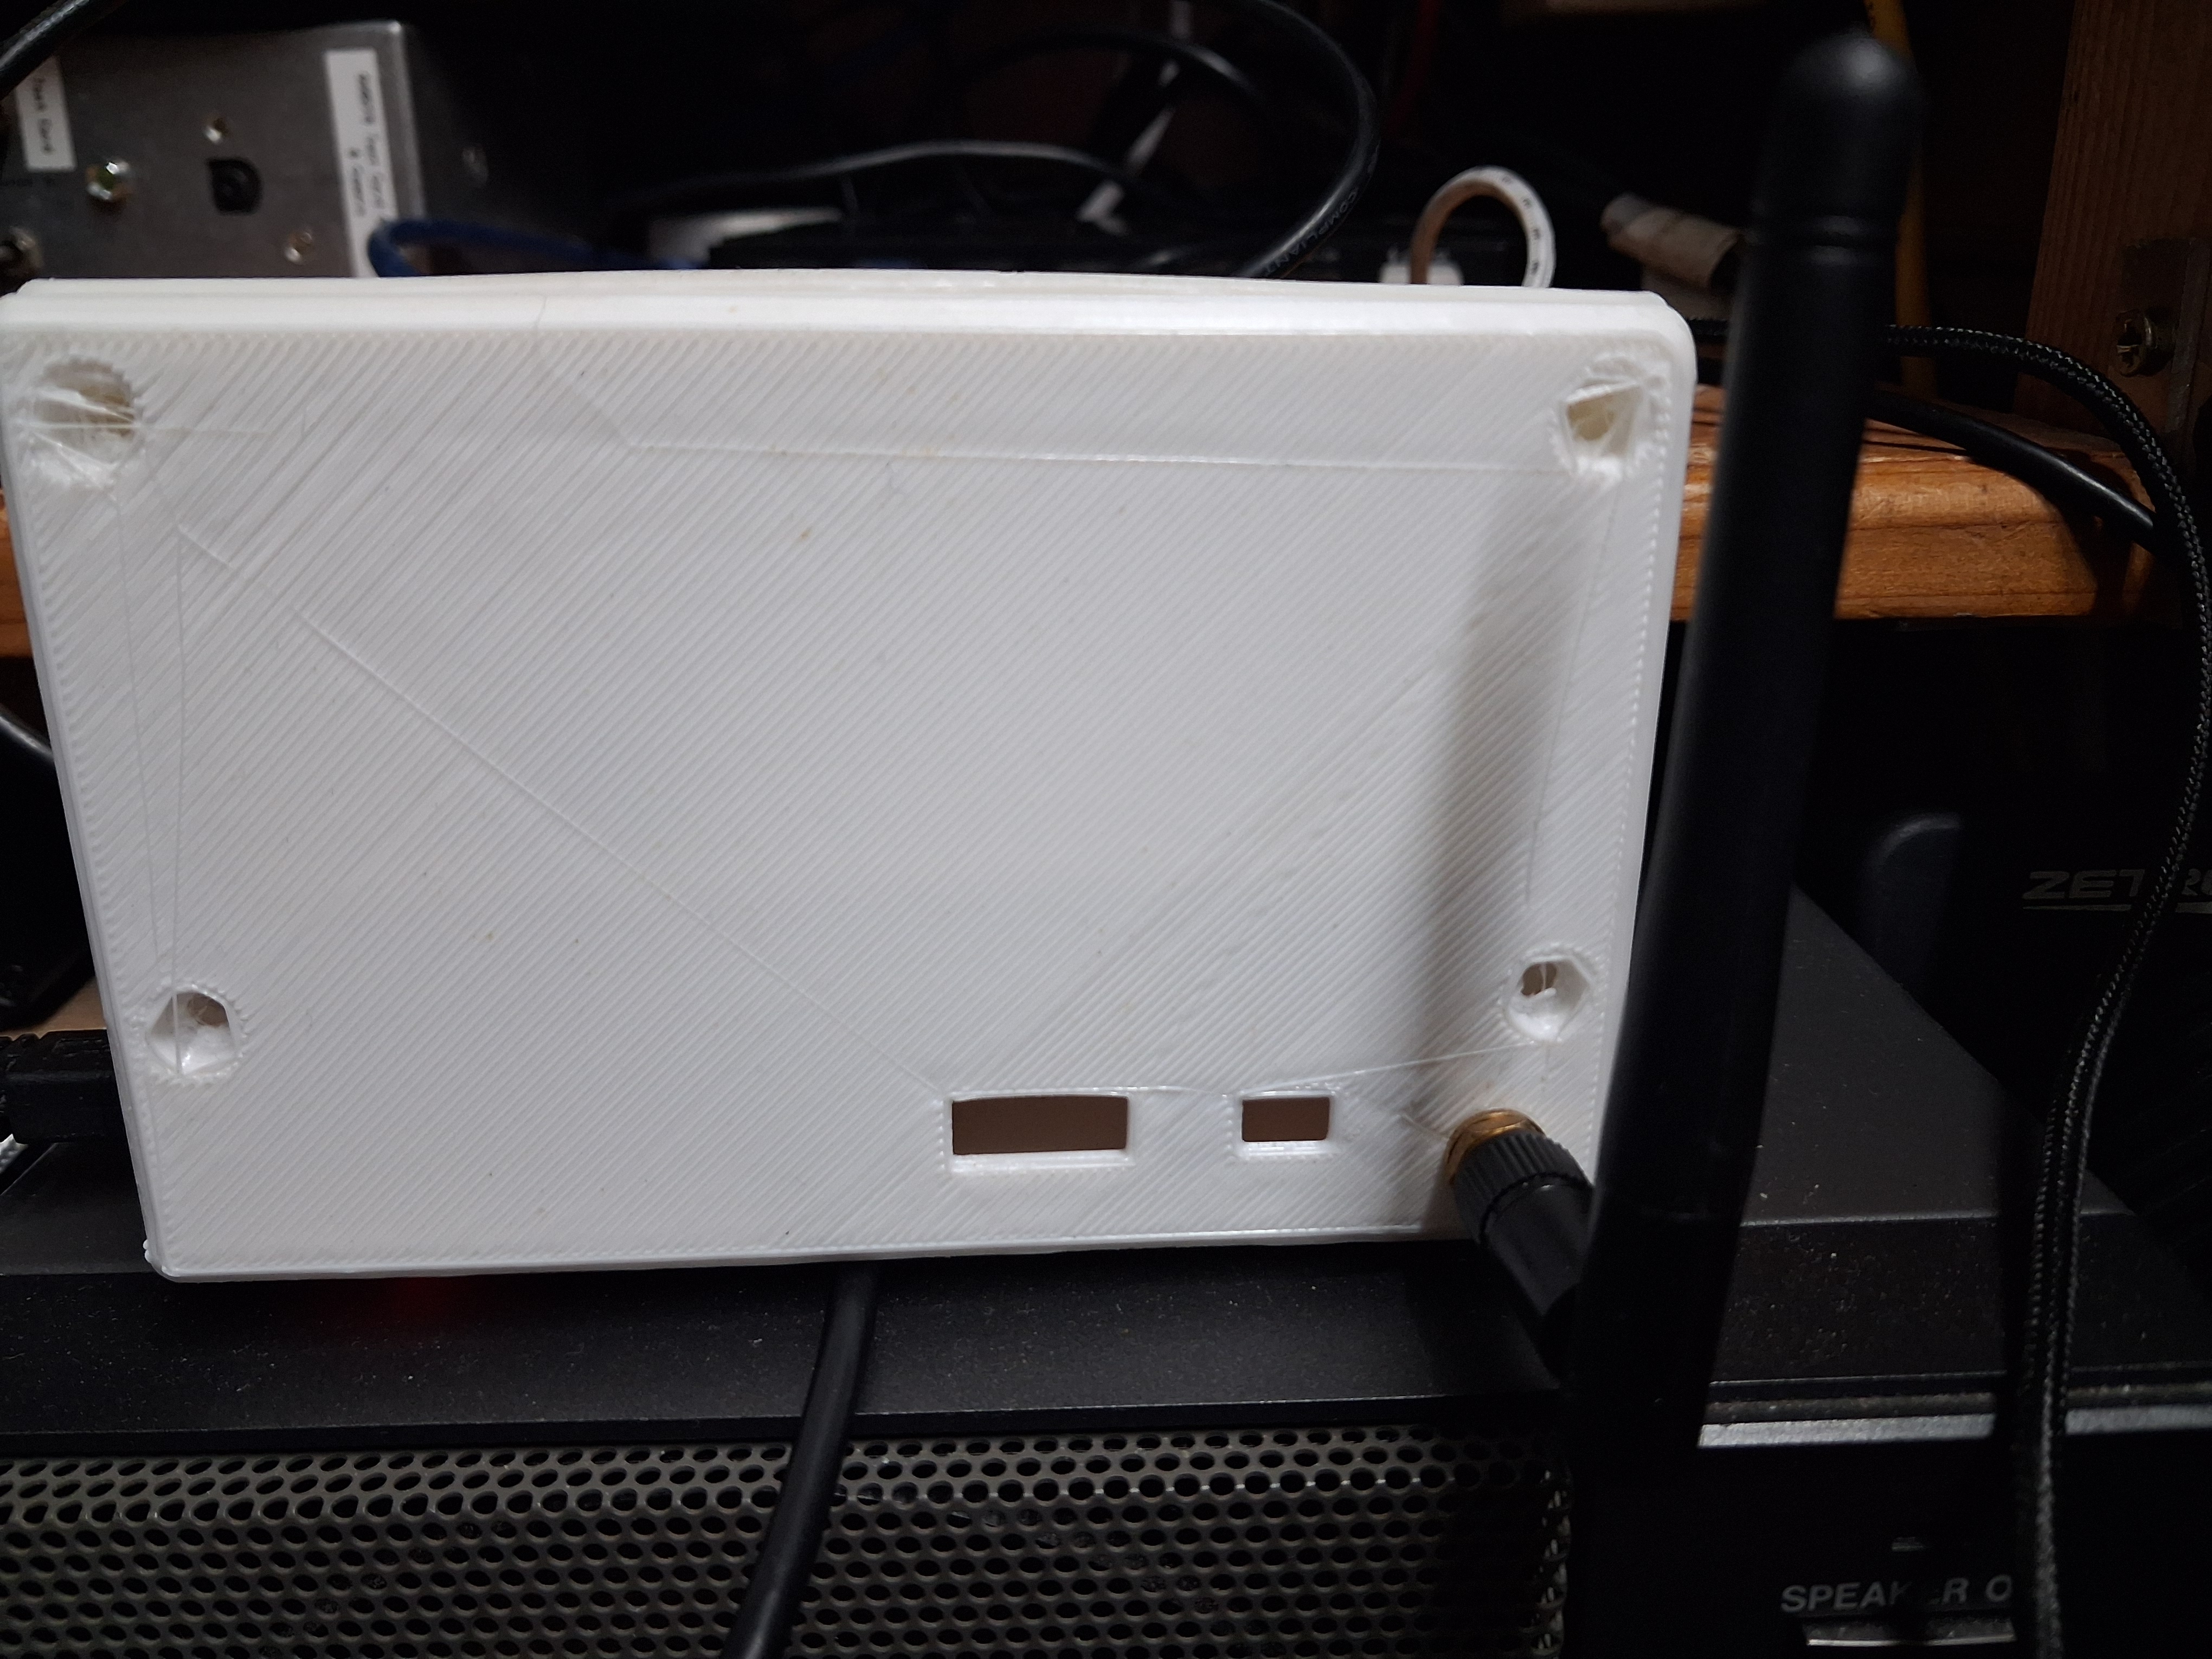
- Hook-up wire or a ribbon cable, and a case of your choice.
- Optional: a push button between GPIO 32 and ground to change page without touching the screen.
- All parts came from AliExpress
- Case STL files STLfiles.zip Download.
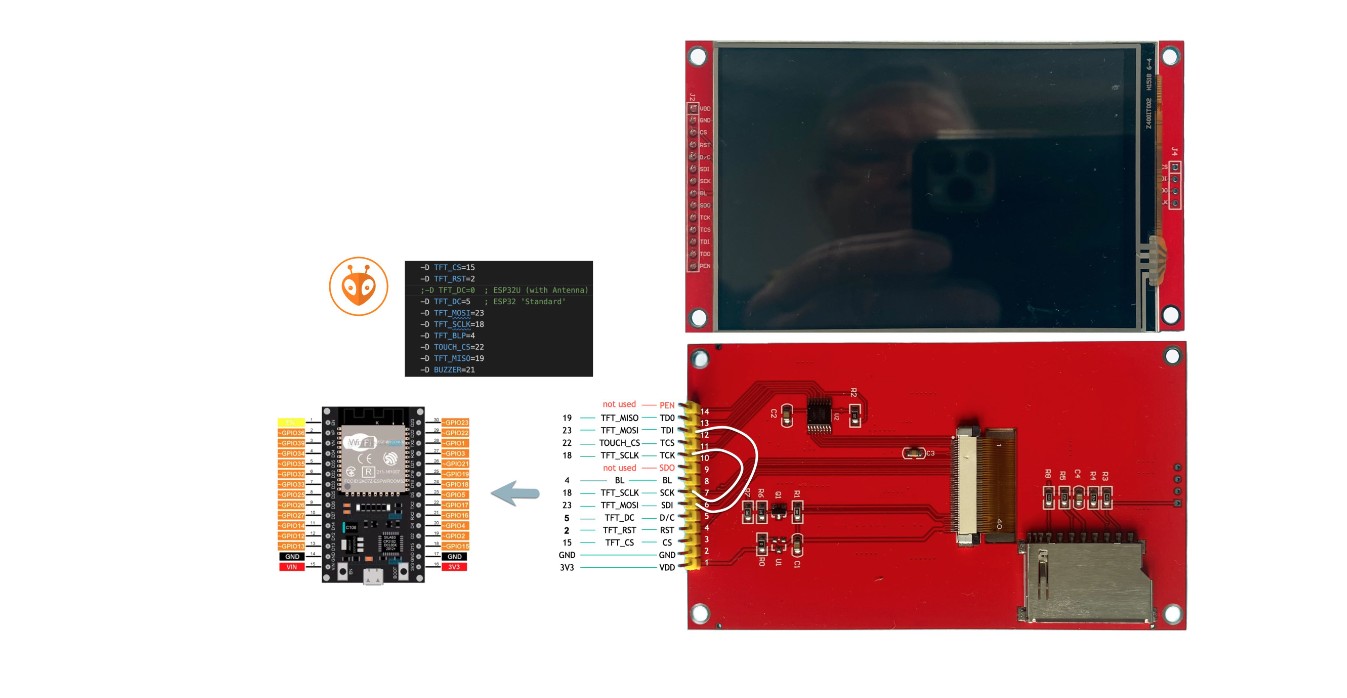
Wiring
| Display | ESP32 pin |
|---|---|
| CS | GPIO 15 |
| DC / RS | GPIO 0 |
| RESET | GPIO 2 |
| SDI (MOSI) | GPIO 23 |
| SCK | GPIO 18 |
| SDO (MISO) | GPIO 19 |
| Touch CS | GPIO 22 |
| Backlight (LED) | GPIO 4 |
| VCC / GND | 3.3 V (or 5 V if the module has a regulator) / GND |
The touch chip shares the display’s MOSI, SCLK and MISO lines. This pin arrangement follows the one used by HB9IIU’s ESP32 ISS Tracker for the same kind of display.
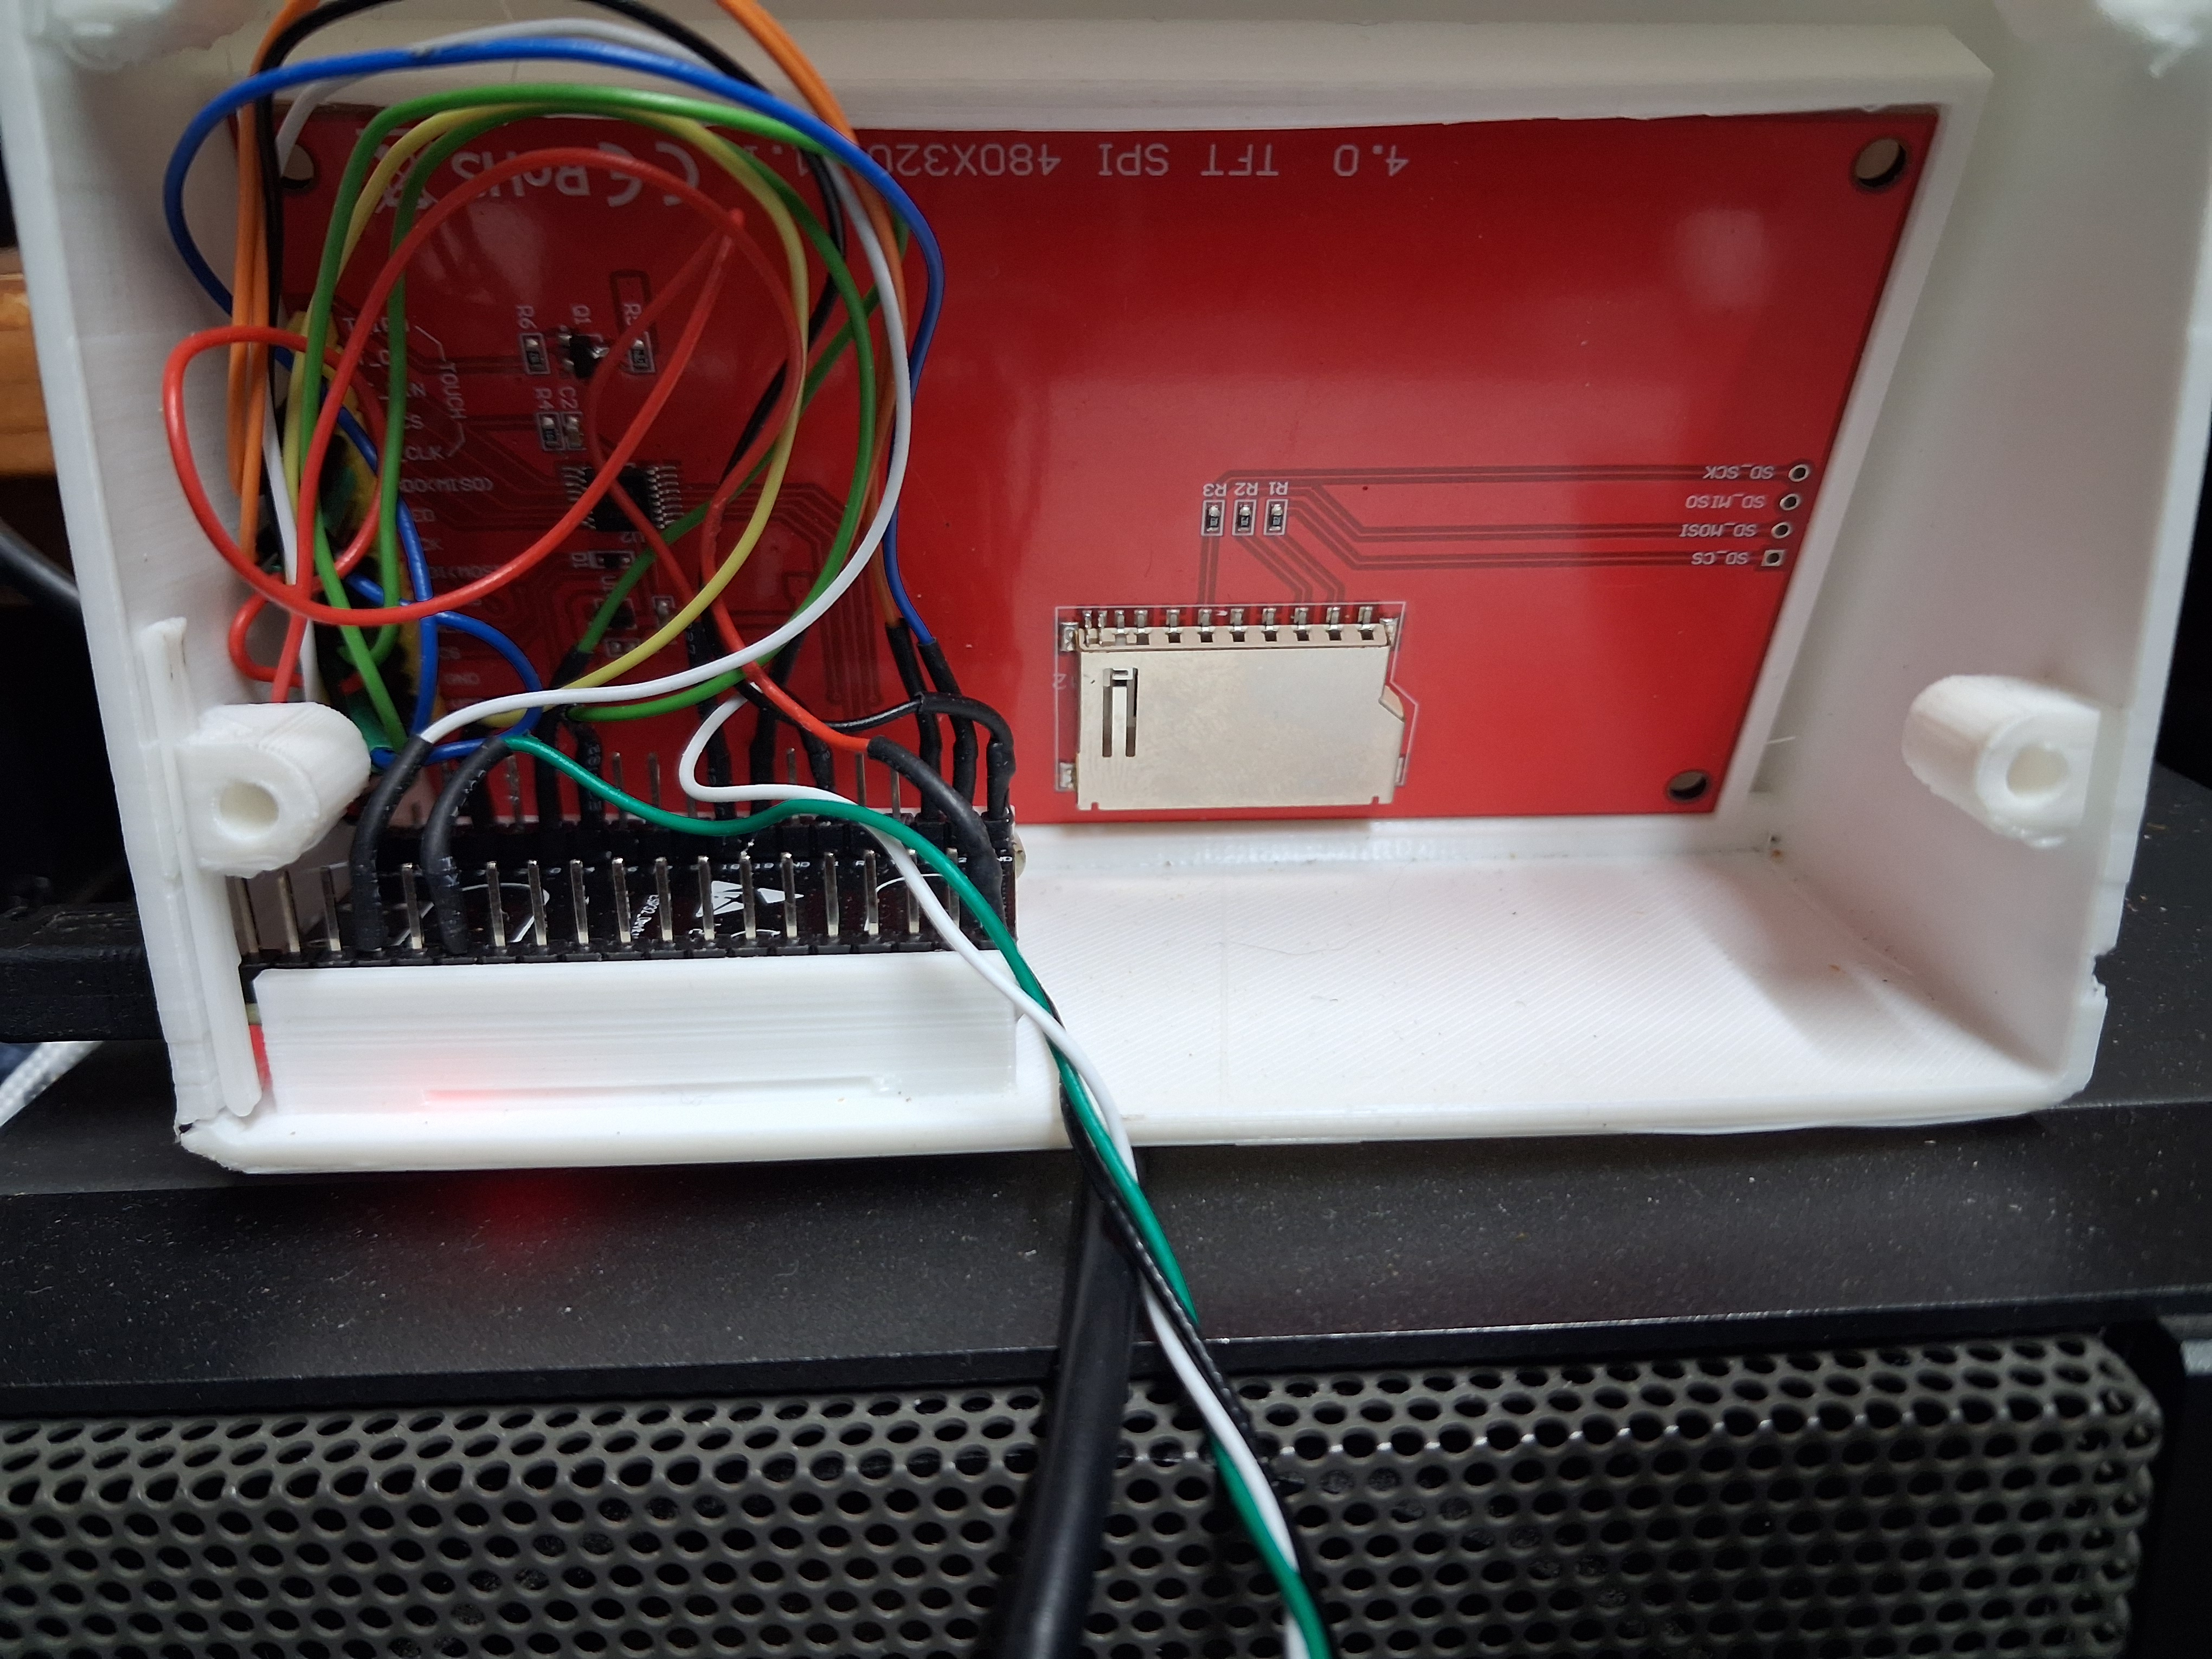
The software
The firmware is written in C++ for the Arduino framework and built with PlatformIO in Visual Studio Code. It uses three open-source libraries: TFT_eSPI for the display, WiFiManager for the Wi-Fi set-up page, and ArduinoJson for reading the weather and tide data. All of the page layouts, the moon and sun calculations and the DX cluster connection are in a single source file.
Putting it together
- Wire the display to the ESP32 using the table above. Check the connections twice before powering up. A wrong wire is the usual cause of a blank or white screen.
- Install the firmware. The easy way is the web flasher: plug the ESP32 into a computer’s USB port, open the flasher page in Chrome or Edge, click Connect and install and pick the serial port. Web flasher page
- Join the set-up Wi-Fi. After flashing, the GARS emblem shows for 5 seconds and the unit creates a Wi-Fi network called
SolarMonitor-Setup. Join it from a phone, choose your home network, enter the password, and enter your latitude and longitude. You can also add your callsign for the DX page and up to six characters of text for the top of the solar page. - Set up the touch screen. When asked, swipe left to right across the screen, then top to bottom. This is done once.
- Mount it. Fit the unit into your case and power it from any USB supply.
Anyone who prefers to build the firmware themselves can do so from the source files with PlatformIO.
Using it
On the screen
- Swipe left or right to change page.
- On the DX page, swipe up or down to scroll through older spots, and tap the top strip of the screen to step through the bands.
- The clock in the corner shows UTC.
The settings page
The unit’s address is shown at the bottom of the solar page. Type it into a browser on the same network to change your location, callsign, top-line text, the DX bands shown, an optional tide key, or to re-run the touch set-up.
To start over with the Wi-Fi, power-cycle the unit three times in a row, switching it off within four seconds of each power-on.
Good to know
The tide times are an estimate and for information only. Do not use them if it involves any form of life safety activity, navigation, boating or crossing tidal causeways. The free source is a computer model with coarse resolution, which is not designed for a coast with tides as large and complicated as ours. Official tide tables are the reliable source. Adding a WorldTides key gives data from the nearest real tide station, but it is still not a substitute for the official tables.
- Meteor shower peaks are worked out from a standard list and can differ from the real peak by up to a day. The rates shown are typical visual rates, and radio rates are different.
- Moon phases, equinoxes and solstices are calculated on the unit and were checked against published times to within about a minute, as were sunrise and sunset. Moonrise and moonset are calculated the same way but have been checked less thoroughly, so treat them as accurate to a few minutes.
- Sunrise and sunset assume a flat horizon at sea level, so hills and buildings around you will change the real times a little.
- Local times follow UK rules (GMT and BST).
Credits and thanks
- Solar and band data courtesy of HamQSL.com (N0NBH).
- Weather and tide model data from Open-Meteo.com, licensed CC BY 4.0.
- Optional tide-station data from WorldTides.
- Live spots from the GB7DXG-1 DX cluster.
- Display pin arrangement from HB9IIU’s ESP32 ISS Tracker.
- Libraries: TFT_eSPI, WiFiManager, ArduinoJson. Built with PlatformIO. The web flasher uses ESP Web Tools.
- Please use at your own risk. No guarantee is given or implied.